
Key Benefits
Bulk assays and plate-based methods miss rare clones and can’t connect genotype ↔ epigenetic state ↔ lineage in the same cells. Aging and disease reshape hematopoiesis through subtle clonal dynamics that require high cell counts and multi-omic context to see.
With CpG Methylation Profiling on Tapestri, you can:
- Reveal clonal hematopoiesis earlier by pairing single-cell DNA variants/CNVs with CpG methylation, enabling the ability to detect early heme malignancies.
- Track lineage trajectories retrospectively in human samples with no transgenics required.
- Confidently identify and prioritize new therapeutic or monitoring targets with single-cell multi-omic insights.

Case Study
EPI-Clone study: Clonal tracing with somatic epimutations reveals dynamics of blood ageing.
(Adapted from Scherer M. et al., Nature 643, 478–487 (2025))
- CpG analysis revealed age-dependent mutations, identifying both known and newly detected CH (clonal hematopoiesis) mutations.
- Static CpG UMAPs overlaid with clonal structures showed methylation-based clustering aligned with known CH mutations.
- Lineage tracing demonstrated that stable methylation patterns are less tied to transient differentiation states.
What You Can Uncover
- Age‑linked epigenetic signatures tied to known and newly detected clonal hematopoiesis (CH) mutations.
- Stable methylation states that illuminate clonal structure beyond transient differentiation signals.
- Emergent SNVs with coordinated methylation + lineage shifts – that reveal clone‑specific targets to track.
Applications
- Translational & clinical research teams monitoring clonal hematopoiesis (CH) / Acute Myeloid Leukemia (AML) / Multiple Myeloma (MM) risk, minimal residual disease (MRD), or therapy response.
- Aging & stem-cell biology labs mapping differentiation potential across the lifespan.
- Drug discovery groups prioritizing clone-specific vulnerabilities.
- Therapy developers targeting the epigenome.
Workflow
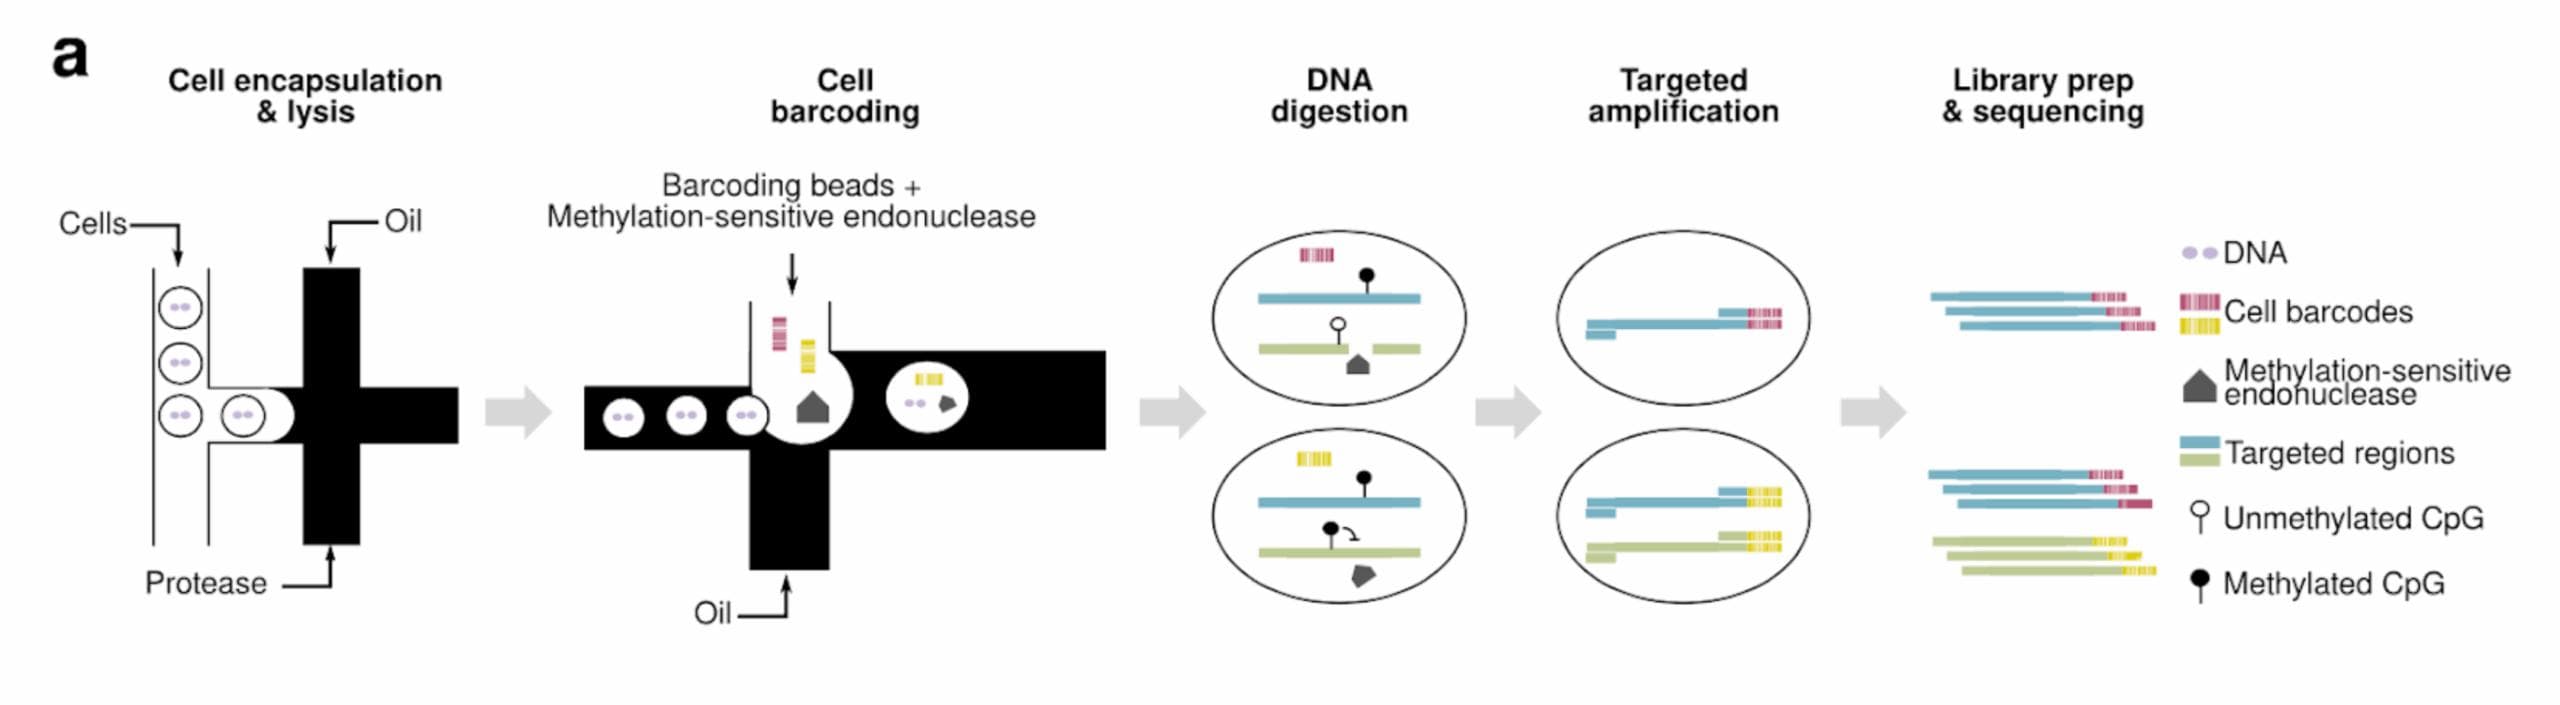
- Prepare single‑cell suspensions from human bone marrow or blood.
- Tapestri DNA (+ Protein optional) to call SNVs/CNVs at single‑cell resolution.
- Add methylation-sensitive endonuclease (scTAM-seq) to target informative CpG loci (bisulfite-free).
- Analyze & visualize with UMAPs, clonal trees, and multi-omic overlays to quantify clonal architecture, methylation states, and trajectories.
Example Data
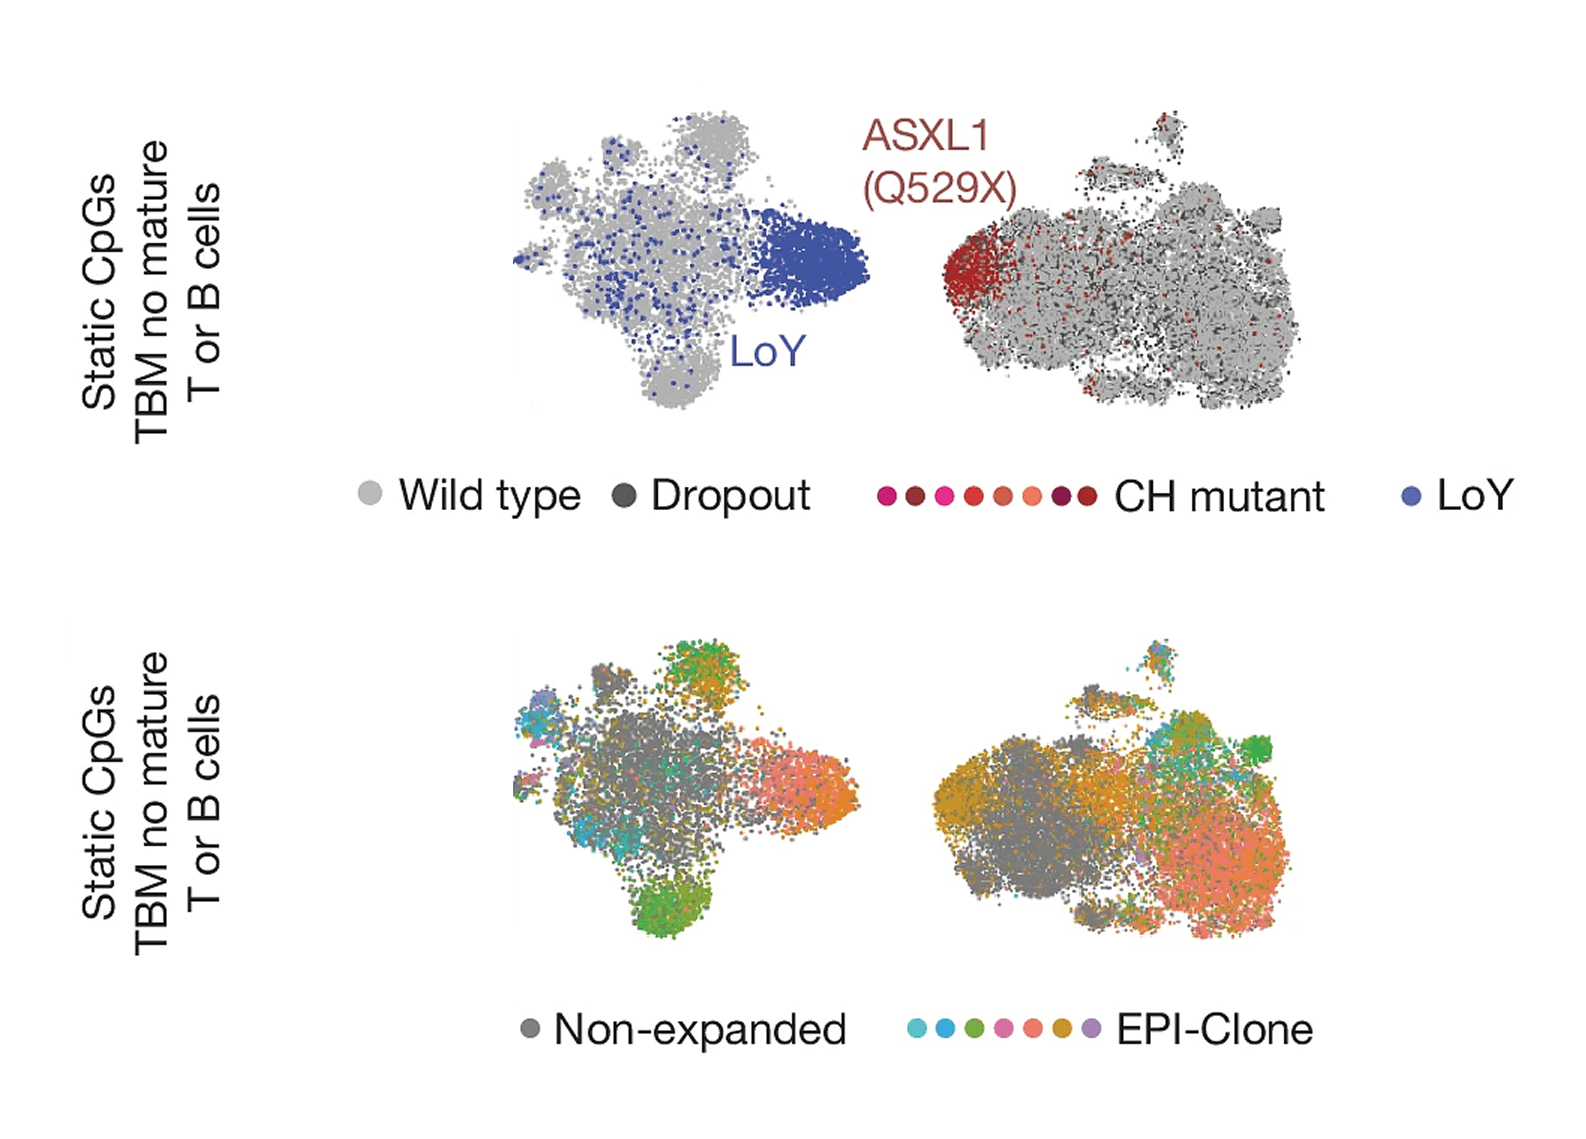
Figure 1: Single-cell DNA and CpG methylation maps showing clonal architecture and lineage composition. (Top) UMAPs display individual cells colored by specific genetic alterations: Loss of Y chromosome (LoY) (A.6, blue) and ASXL1 Q529X mutation (A.7, red), highlighting distinct clonal populations relative to wild-type cells (gray). (Bottom) Corresponding methylation-based cell type maps show lineage annotation according to CpG signature categories (Static CpGs, TBM/no mature, and T or B cells) for the same samples, as indicated in panels c and d at left.
Figure 1 adapted from Scherer M., Singh, I., Braun, M.M et al. Clonal tracing with somatic epmutations reveals dynamics of blood ageing. Nature 643, 478 (2025).


Selected references
- Scherer M. et al., Nature (2025): Clonal tracing with somatic epimutations reveals dynamics of blood ageing.
- Bianchi A. et al., Genome Biology (2022): scTAM‑seq enables targeted high‑confidence single-cell DNA methylation analysis.
- Lareau C.A. et al., bioRxiv (2023): mtDNA features informing evolutionary and somatic fitness.