Why Targeted DNA + RNA Single-Cell Analysis?
By integrating targeted DNA genotyping with RNA expression profiling, you can confidently pinpoint disease-driving variants, uncover resistance mechanisms, and characterize engineered cell populations — all from the same cells.

Refine Disease Classification and Mechanistic Insight
Combine somatic mutation and expression profiles to distinguish subclones, identify driver mutations, and reveal dysregulated pathways driving disease progression.

Accelerate Biomarker and Drug Target Discovery
Link genomic variants to functional RNA readouts to confirm target expression, uncover actionable biomarkers, and validate therapeutic mechanisms.

Advance Cell and Gene Therapy Characterization
Correlate gene editing outcomes and vector copy number with transcriptional changes to verify on-target activity, assess efficacy, and ensure functional validation.
Applications
Oncology
Tumor Classification & Clonal Subtyping
- Combining somatic mutation profiles (DNA) with transcriptional signatures (RNA) allows more precise stratification of cancers
Identifying Driver Mutations & Pathway Dysregulation
- DNA reveals recurrent driver mutations, and RNA shows their influence on regulatory pathways
Predicting Therapy Response
- RNA analysis can reveal alternative splicing, pathway rewiring, or activation of bypass signaling
Target Discovery & Rare Disease
Drug Target Discovery & Biomarker Development
- DNA detects mutations targetable by drugs and RNA validates that the gene is actually expressed, contributing to the disease state
Rare Genetic & Inherited Disorders
- Many rare disorders arise from post-zygotic DNA mutations present in only a subset of cells. Multi-omics can connect the DNA mutation to aberrant RNA signatures.
Therapy Response & Mechanism of Action
- RNA profiling can reveal whether a therapy achieves its intended effects by monitoring upregulation or inhibition of target genes, providing a direct readout of functional impact.
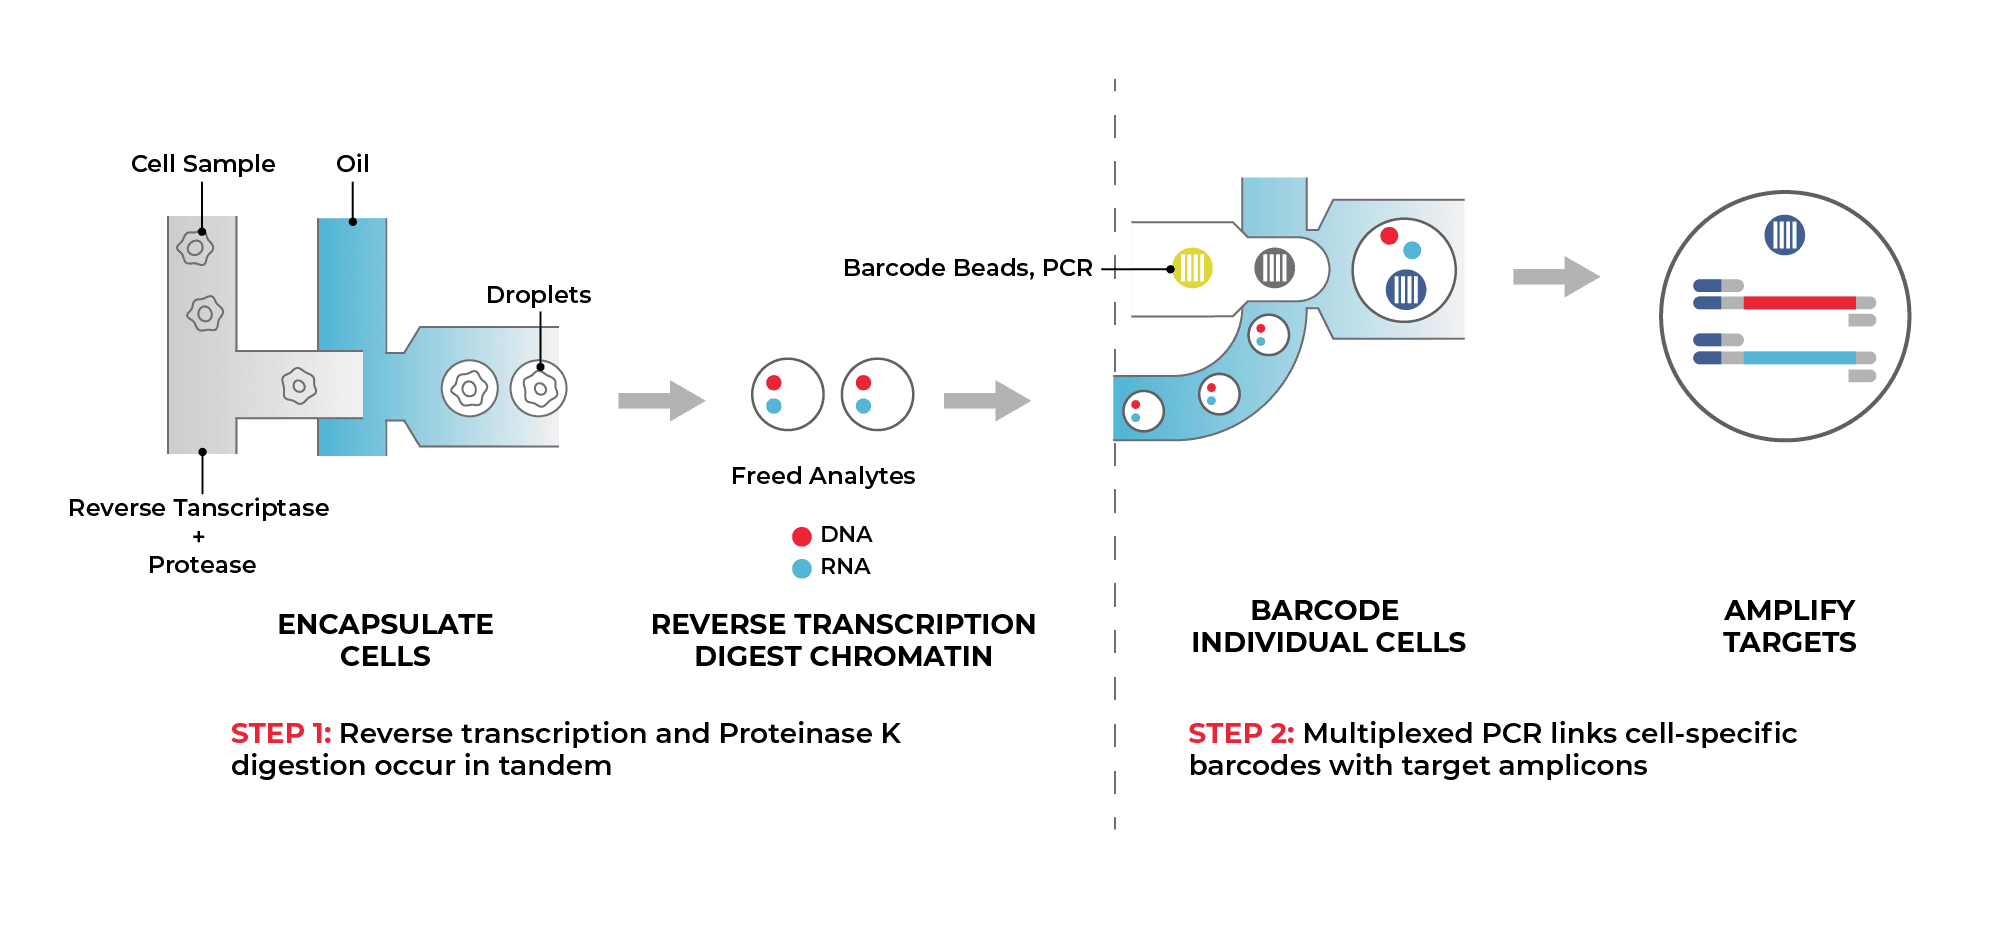
Workflow
Tapestri Single-Cell DNA + RNA Workflow
Translate Insight Into Action With Fully Interpreted Results
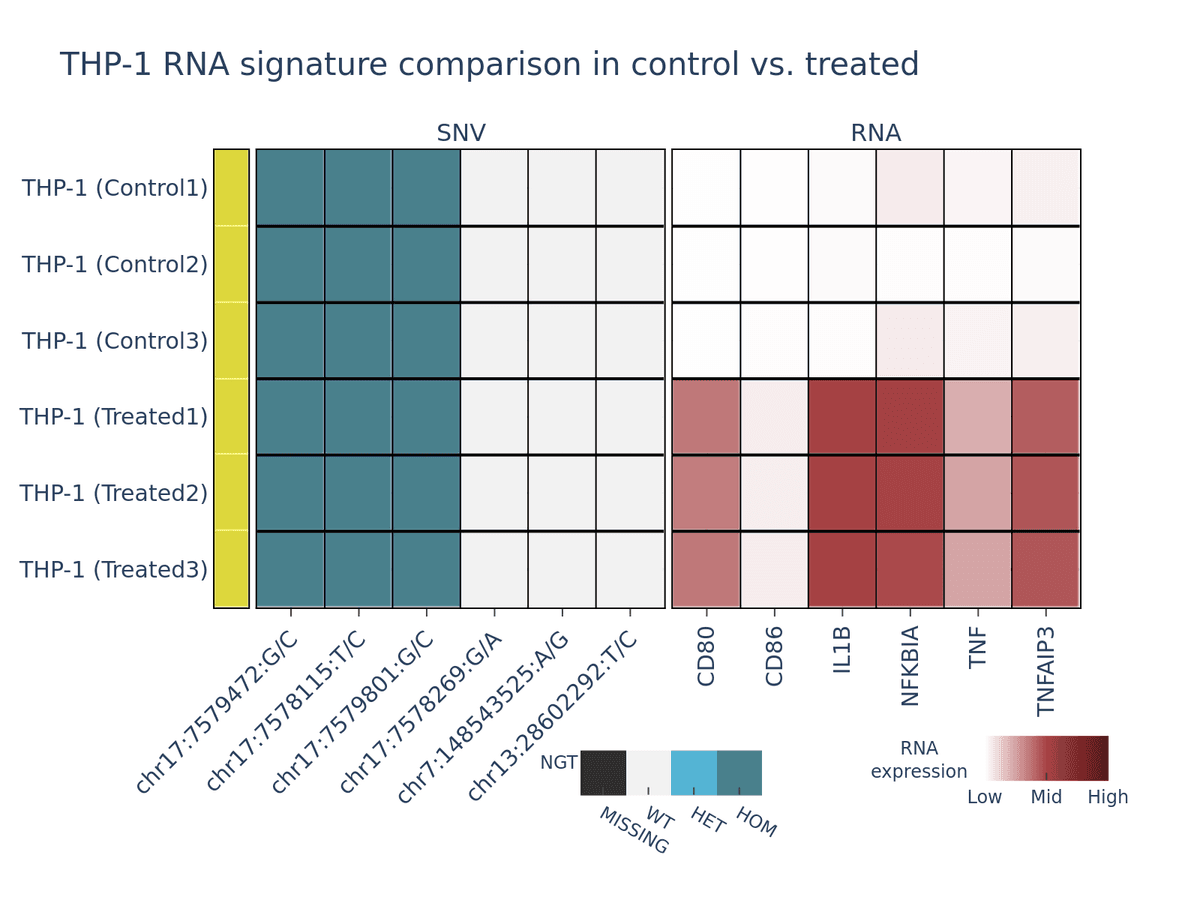
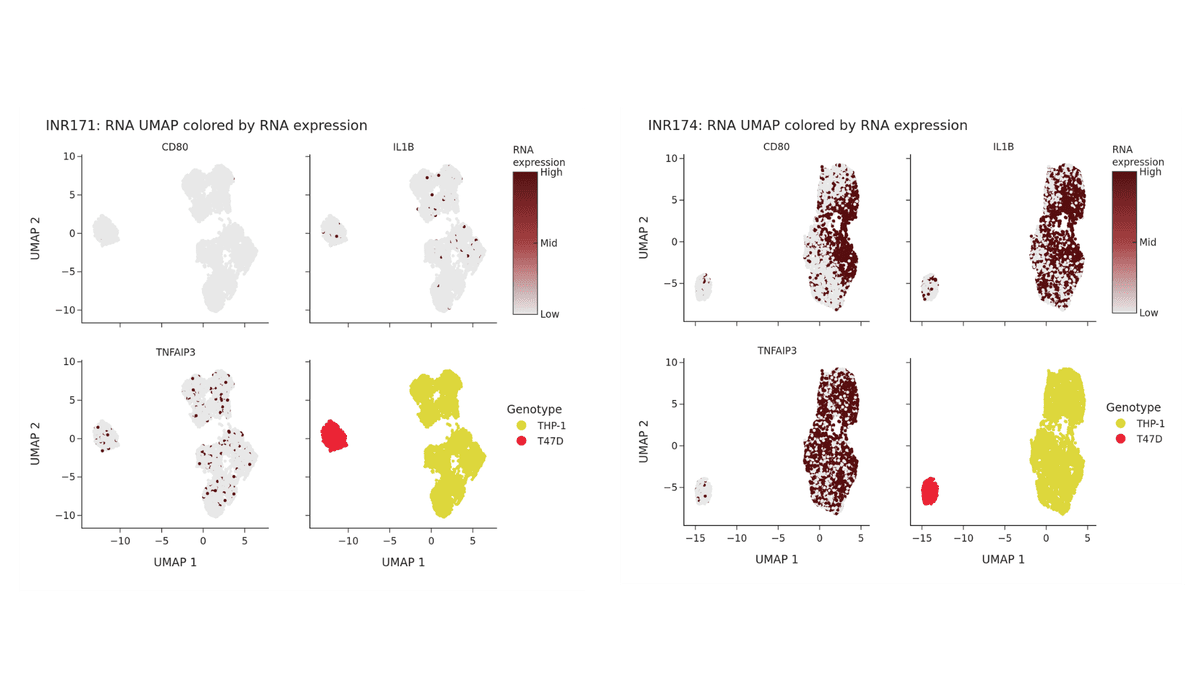
This experiment highlights the power of the Tapestri® platform to distinguish cell types based on both genotype and gene expression profiles. A monocyte-like cell line (THP-1) was initially mixed with a 10% spike-in of the breast cancer cell line T47D and analyzed on Tapestri® to establish a baseline gene expression profile.
Next, the THP-1 cells were stimulated with lipopolysaccharide (LPS) and again mixed with a 10% spike-in of untreated T47D cells before being run on Tapestri®.
Because the genotypic profiles of the two cell lines remain distinct, genotype-based demultiplexing enables clear identification of each population. Within the THP-1 population, however, LPS treatment induces a measurable shift in gene expression, while the T47D spike-in remains transcriptionally unchanged.
These transcriptional changes in the treated THP-1 cells are evident in both the heatmap (Figure 1) and the UMAP projection (Figure 2) below.