
Revealing Hidden Pathogenic Clones with Single-Cell Multiomic Cohort Analysis
Patient samples are inherently heterogenous, consisting of different clones: wildtype, pathogenic yet therapeutically targetable clones and lastly pathogenic clones. Traditional bulk methods like next-generation sequencing (NGS) or flow cytometry provide population-level snapshots, but they often miss critical co-occurring features that can drive therapeutic resistance.


🔍 Legend:
DNA Genotype
- ⚪ Grey Nucleus: Wild Type (no known pathogenic mutation)
- 🔴 Red Nucleus: Pathogenic (harboring a disease-associated mutation)
Surface Phenotype (Flow Cytometry Marker)
- ⚪ Gray Outline: Wild Type (no abnormal surface protein expression)
- 🟠 Orange Outline: Therapeutically Targetable (expressing a surface marker that can be targeted by therapy)
Single-cell multiomic analysis with Tapestri, enhanced by single-cell bioinformatics, uniquely uncovers hidden pathogenic clones by integrating genotype (DNA) and immunophenotype (surface protein) data at the single-cell level.
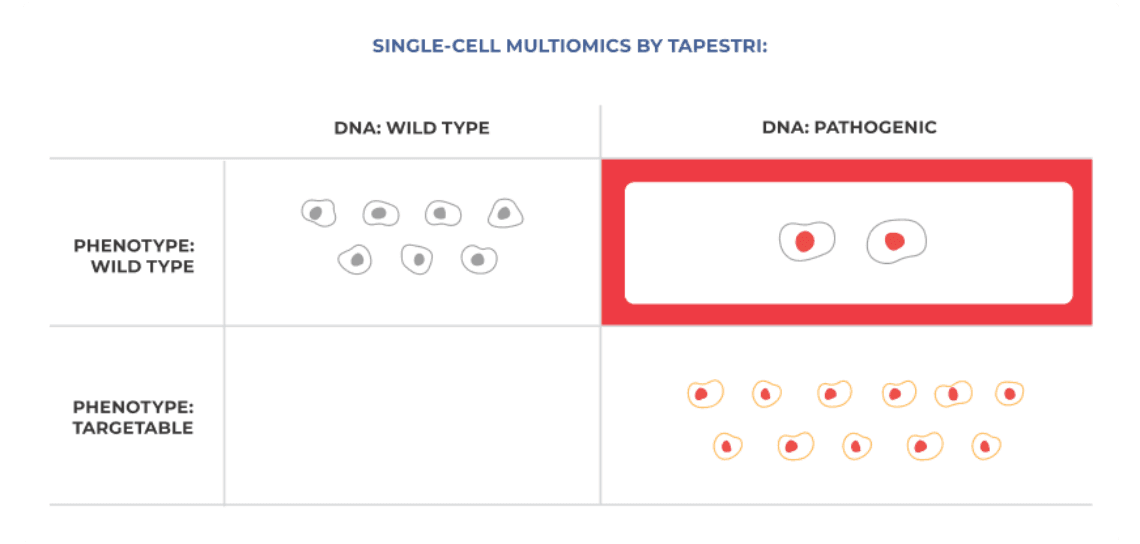
Single-analyte methods like bulk NGS and flow cytometry cannot uncover co-occurring features that may drive therapeutic resistance (top right quadrant). Single-cell multiomic cohort analysis reveals these hidden insights by integrating temporal perspective to genotypic and immunophenotypic data at single-cell resolution.
Key Insights:
- Top Right Quadrant (DNA: Pathogenic, Phenotype: Wild Type): Pathogenic clones with a wild-type surface phenotype are invisible to surface-marker-based detection methods like flow cytometry. These hidden clones may evade standard treatments and drive resistance or relapse.
- Bottom Right Quadrant (DNA: Pathogenic, Phenotype: Targetable): Identifiable pathogenic clones that can be targeted therapeutically.
- Left Quadrants (DNA: Wild Type): Both wild-type genotypes with wild-type or targetable phenotypes, which are less clinically concerning.
Single-cell multiomic analysis enables unparalleled resolution by mapping both genotype and phenotype in individual cells—highlighting clones that would otherwise remain undetected. This integrated view is essential for developing effective therapies and understanding disease progression in complex, heterogeneous samples.

Mechanisms of Resistance
Identify transcriptional and mutational signatures in resistant vs. sensitive patients to uncover pathways driving therapy escape and clonal persistence.

Stratifying Responders
Compare genomic and phenotypic profiles across patient cohorts to distinguish biomarkers and cell states associated with therapeutic response.

Profiling Disease Heterogeneity
Resolve subclonal diversity within and across patients to understand the molecular complexity underlying disease progression and treatment variability.
The Cohort Analysis Pipeline
All cohort analysis begins with high-resolution single-cell sequencing powered by Mission Bio’s Tapestri platform, which captures DNA and protein-level data from each individual cell.
The cohort analysis pipeline, powered by advanced single-cell bioinformatics, combines patient sample and time points from h5 files generated from Mission Bio’s Tapestri platform to generate a heatmap across multiple attributes.
Attributes such as clonal fraction, VDJ clonotypes, prognostic structural variants and counts, as well as focal CNV, mutations and prognostic protein markers can be visualized and trends can be compared across samples, demonstrating clonal dynamics that impact disease progression.
Clonal Architecture and Multi-Omic Profiling of PBMC Clones Using Mission Bio's Mosaic Cohort Analysis
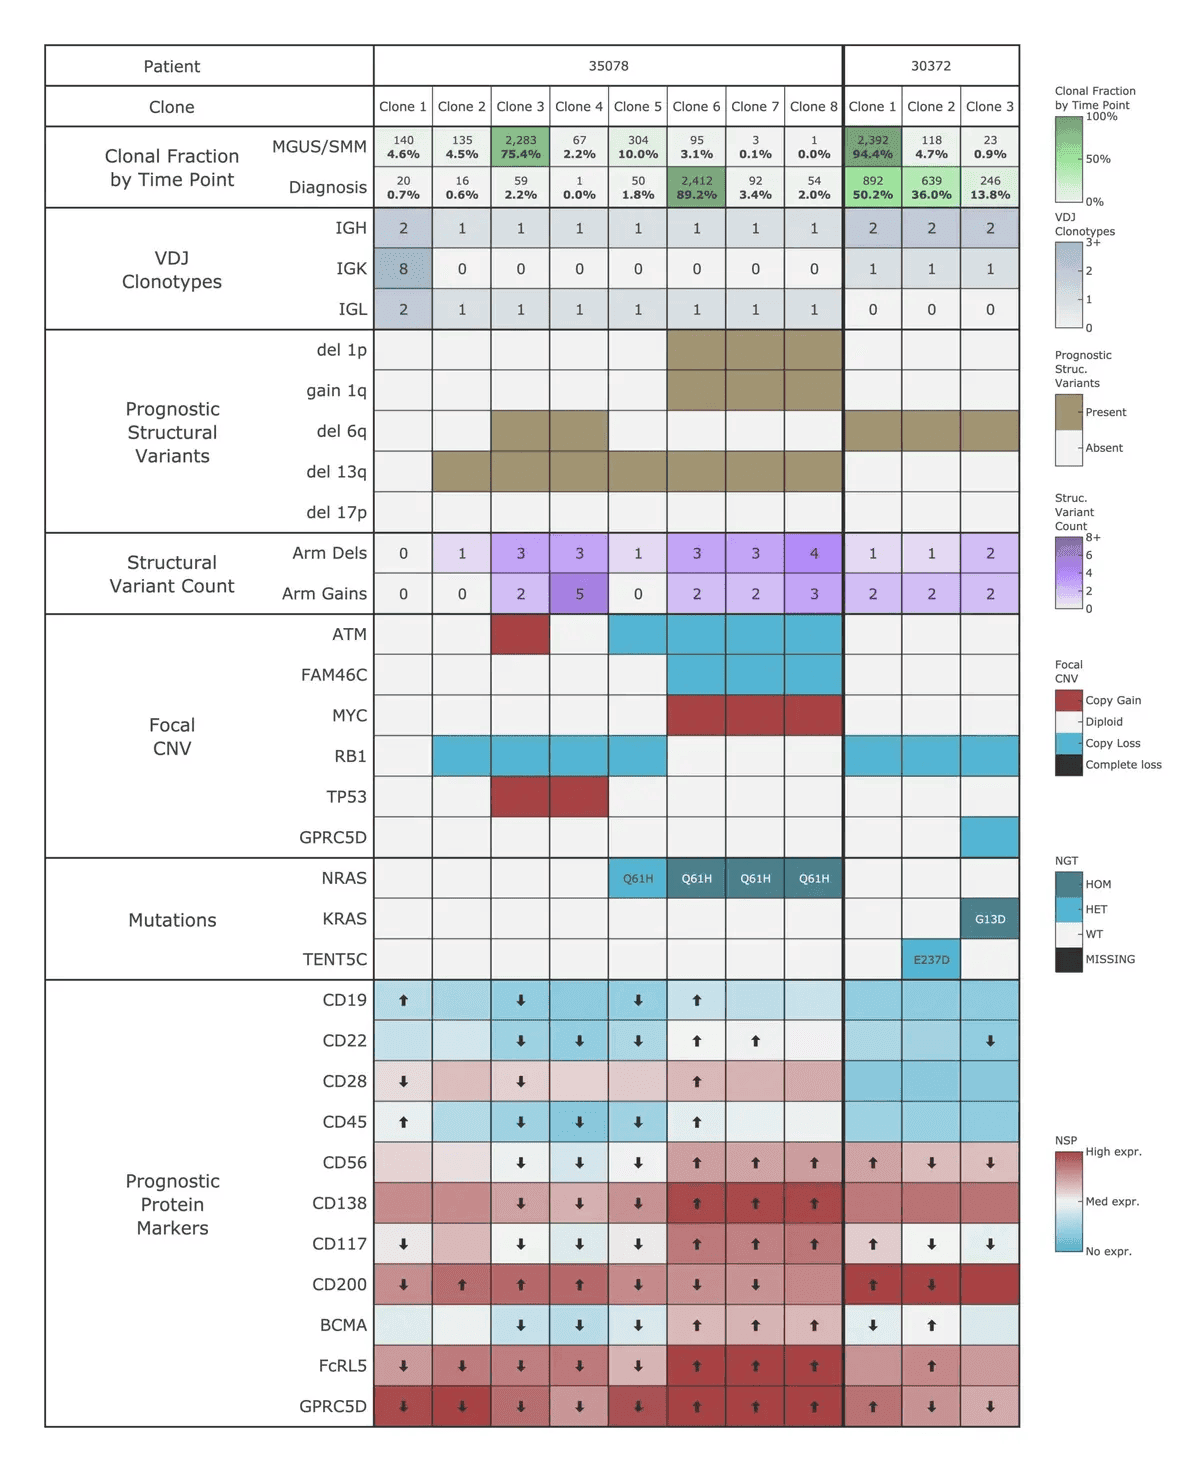
This figure illustrates the clonal landscape of two patients with precursor plasma cell neoplasms (MGUS/SMM), as characterized using the Cohort Analysis pipeline. Each row represents a layer of multi-omic data resolved at the single-cell level, and each column represents a genetically distinct clone identified within the sample.
The analysis integrates:
- Clonal Abundance Over Time: The top section shows the relative abundance of each clone at different time points, highlighting clonal evolution and disease dynamics.
- VDJ Clonotypes: Immunoglobulin heavy and light chain usage per clone reveals lineage relationships and clonal expansions.
- Structural Variants and Copy Number Alterations: Detected chromosomal aberrations (e.g., del 1p, gain 1q) and focal copy number changes in oncogenes (e.g., MYC, TP53) provide insight into genomic instability and malignant potential.
- Somatic Mutations: Clone-specific mutations in key driver genes (NRAS, KRAS, TENT5C) are shown with their specific amino acid changes and zygosity.
- Surface Protein Expression: A panel of prognostic markers (e.g., CD19, CD56, BCMA, CD138) is profiled at the single-cell level, linking immunophenotype to genotype across clones.
This multi-dimensional view enables deep characterization of disease heterogeneity and clonal evolution, offering insights into progression risk, therapeutic target expression (e.g., BCMA), and potential for relapse. The Cohort analysis Pipeline on Mosaic is uniquely suited to resolve these complex relationships, empowering translational research and precision medicine in hematologic malignancies.
Clonal Architecture at MGUS Diagnosis
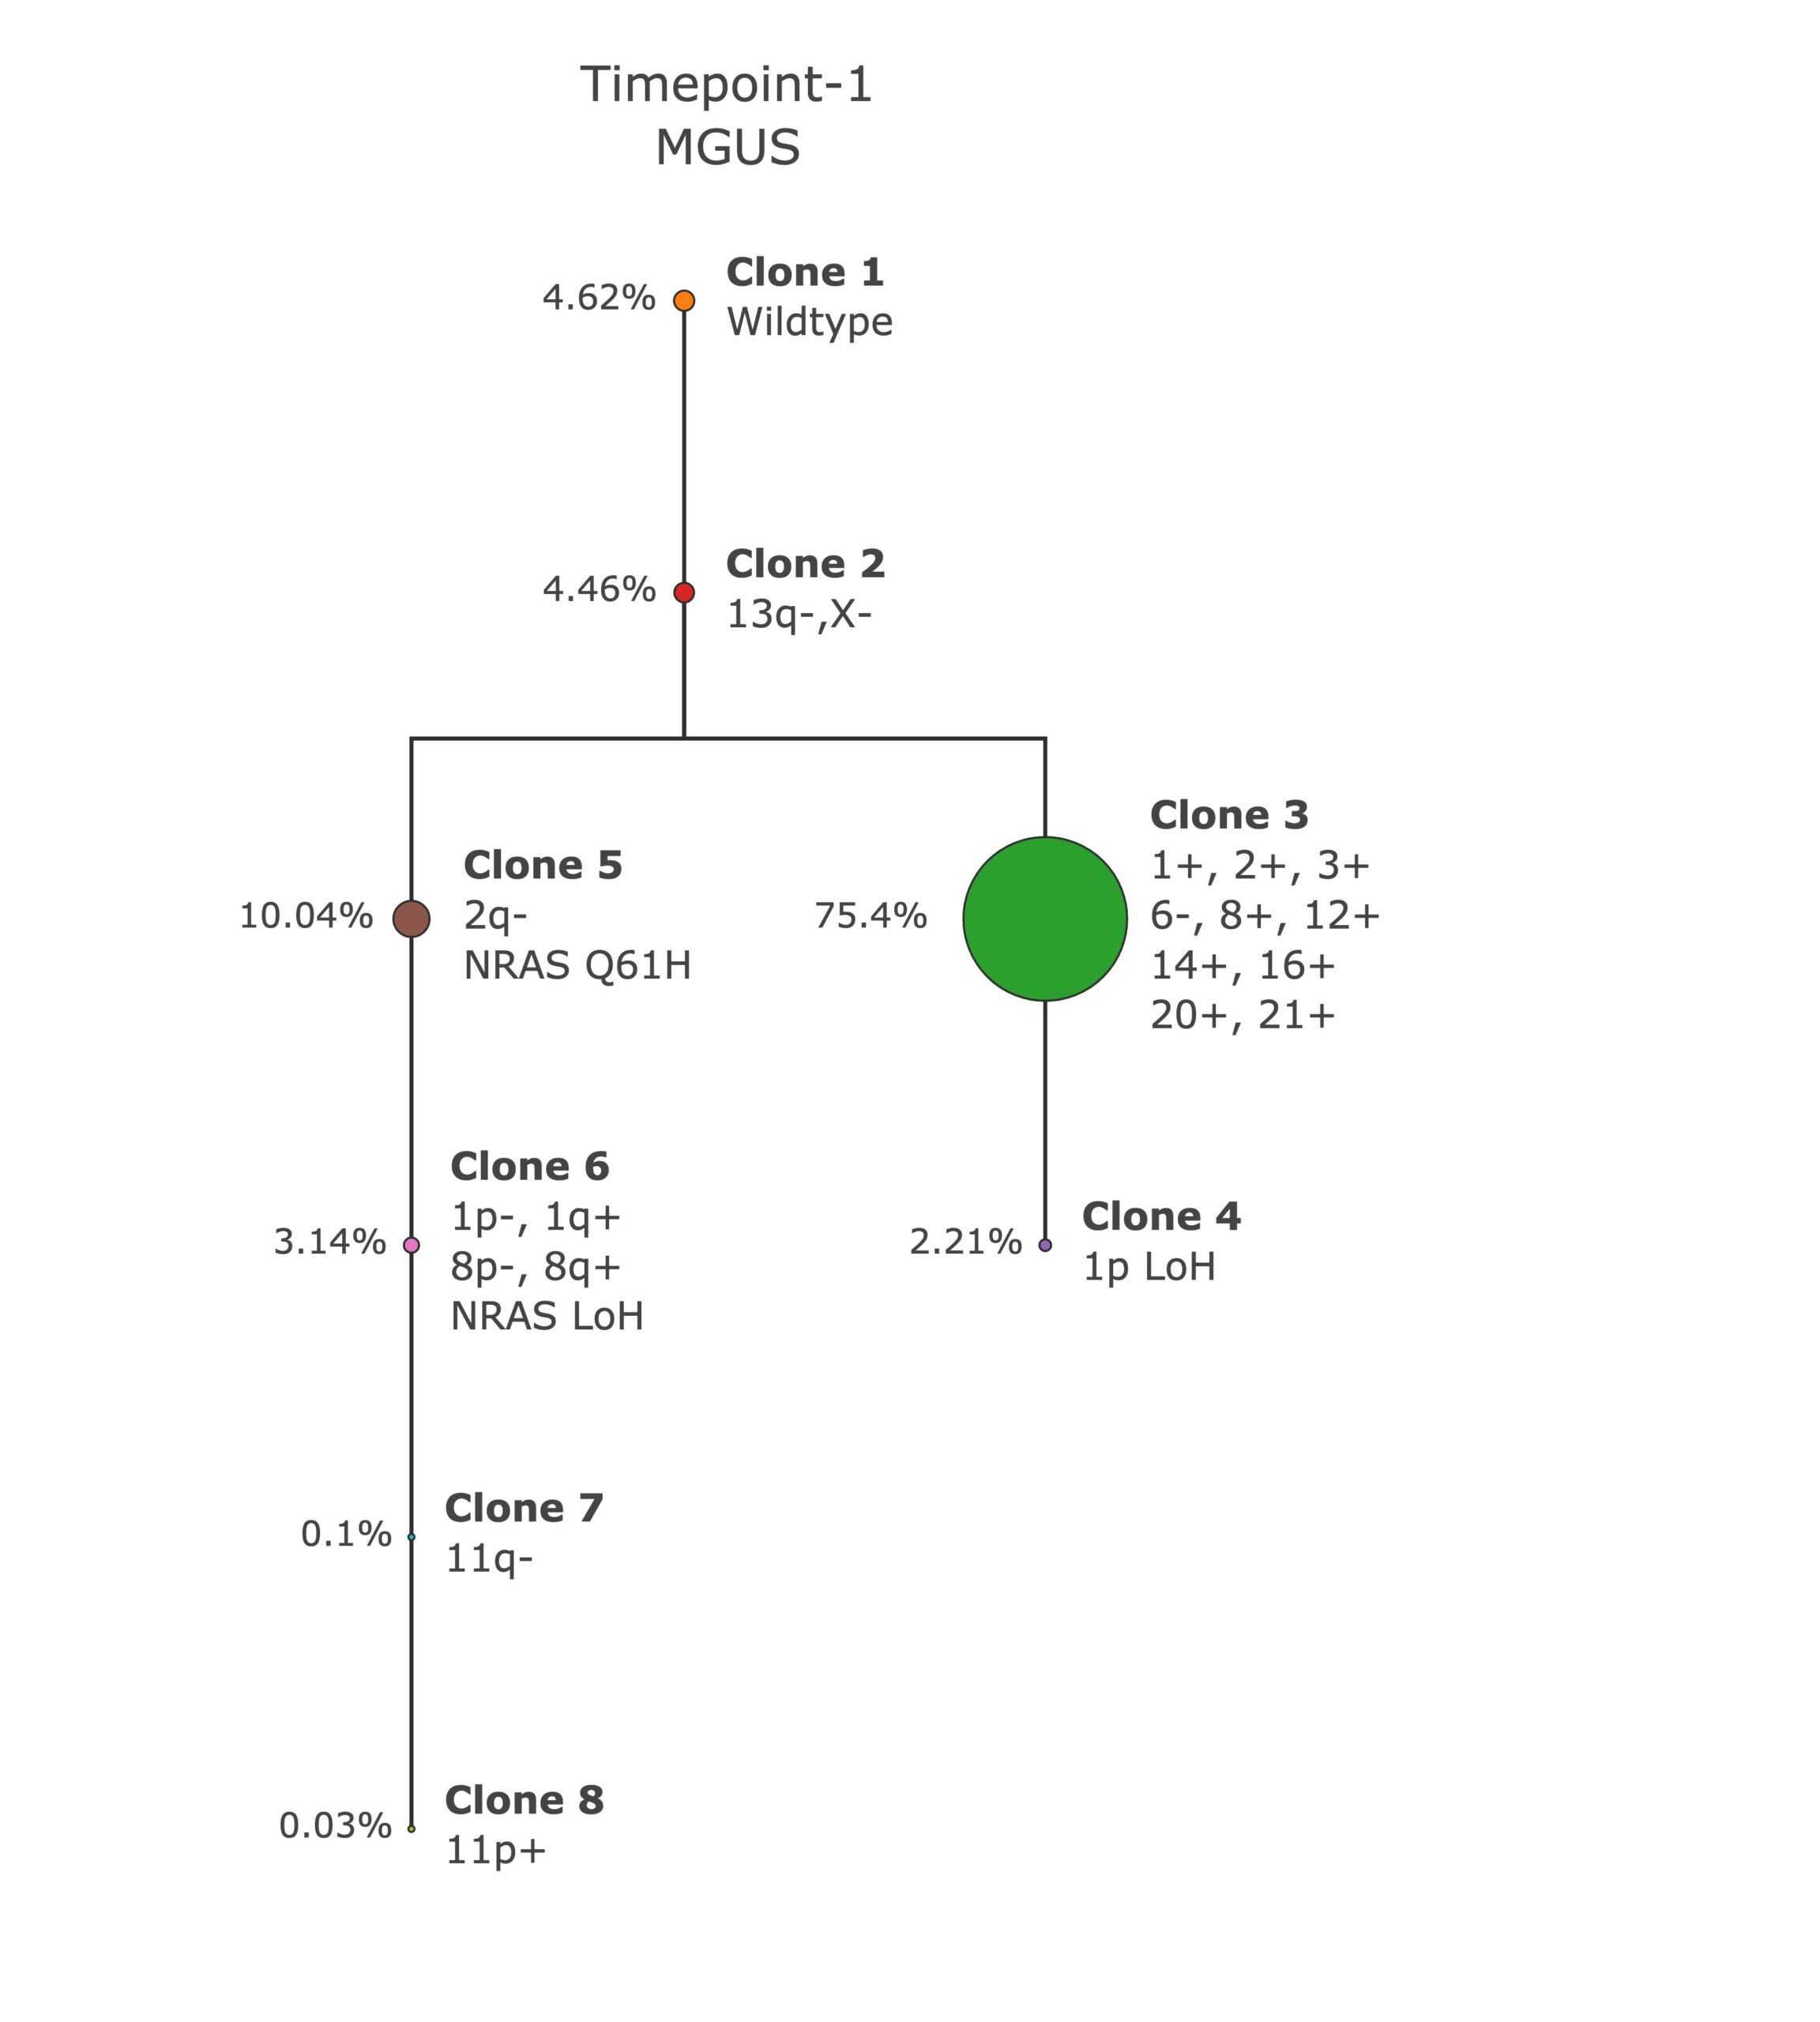
This phylogenetic tree was generated using the Cohort Analysis pipeline to visualize the clonal evolution and mutational landscape in a patient at Timepoint-1, diagnosed with Monoclonal Gammopathy of Undetermined Significance (MGUS)
Overview:
Learn more about how Cohort Analysis is powered by Mosaic.
The diagram illustrates the clonal structure of hematopoietic cells, highlighting the genetic heterogeneity present at the single-cell level. Each node represents a genetically distinct clone, annotated with its specific genomic alterations and the proportion of total cells it comprises.
Key Observations:
- Clone 1 (Wildtype):
Representing 4.62% of the total population, this clone has no detectable somatic alterations and serves as the ancestral cell population. - Clone 2 (13q-, X-):
An early subclonal population (4.46%) with deletions in chromosome 13q and loss of the X chromosome. - Clone 3 (75.4%):
The dominant clone, harboring multiple chromosomal gains and losses (1+, 2+, 3+, 6-, 8+, 12+, 14+, 16+, 20+, 21+), suggesting complex karyotypic evolution. This clone likely drives the MGUS phenotype. - Clone 5 (10.04%):
Contains a 2q deletion and a NRAS Q61H mutation, indicating activation of oncogenic signaling pathways. - Clone 6 (3.14%):
Exhibits chromosomal imbalances on chromosomes 1 and 8, along with NRAS loss of heterozygosity (LoH), which may reflect subclonal adaptation or resistance mechanisms. - Clone 4 (2.21%):
Features 1p LoH, potentially impacting tumor suppressor genes in this region. - Clones 7 and 8:
Minor populations with 11q- (0.1%) and 11p+ (0.03%) respectively, indicating additional low-frequency events.
Interpretation:
This clonal map reveals a branched evolution pattern, where a wildtype progenitor gives rise to progressively complex subclonal populations. The high frequency of Clone 3 suggests strong clonal dominance, while subclones with NRAS mutations may indicate early oncogenic events contributing to disease progression. These findings underscore the value of single-cell DNA analysis for early detection and monitoring of clonal dynamics in precursor conditions like MGUS.
Clonal Architecture at Diagnosis
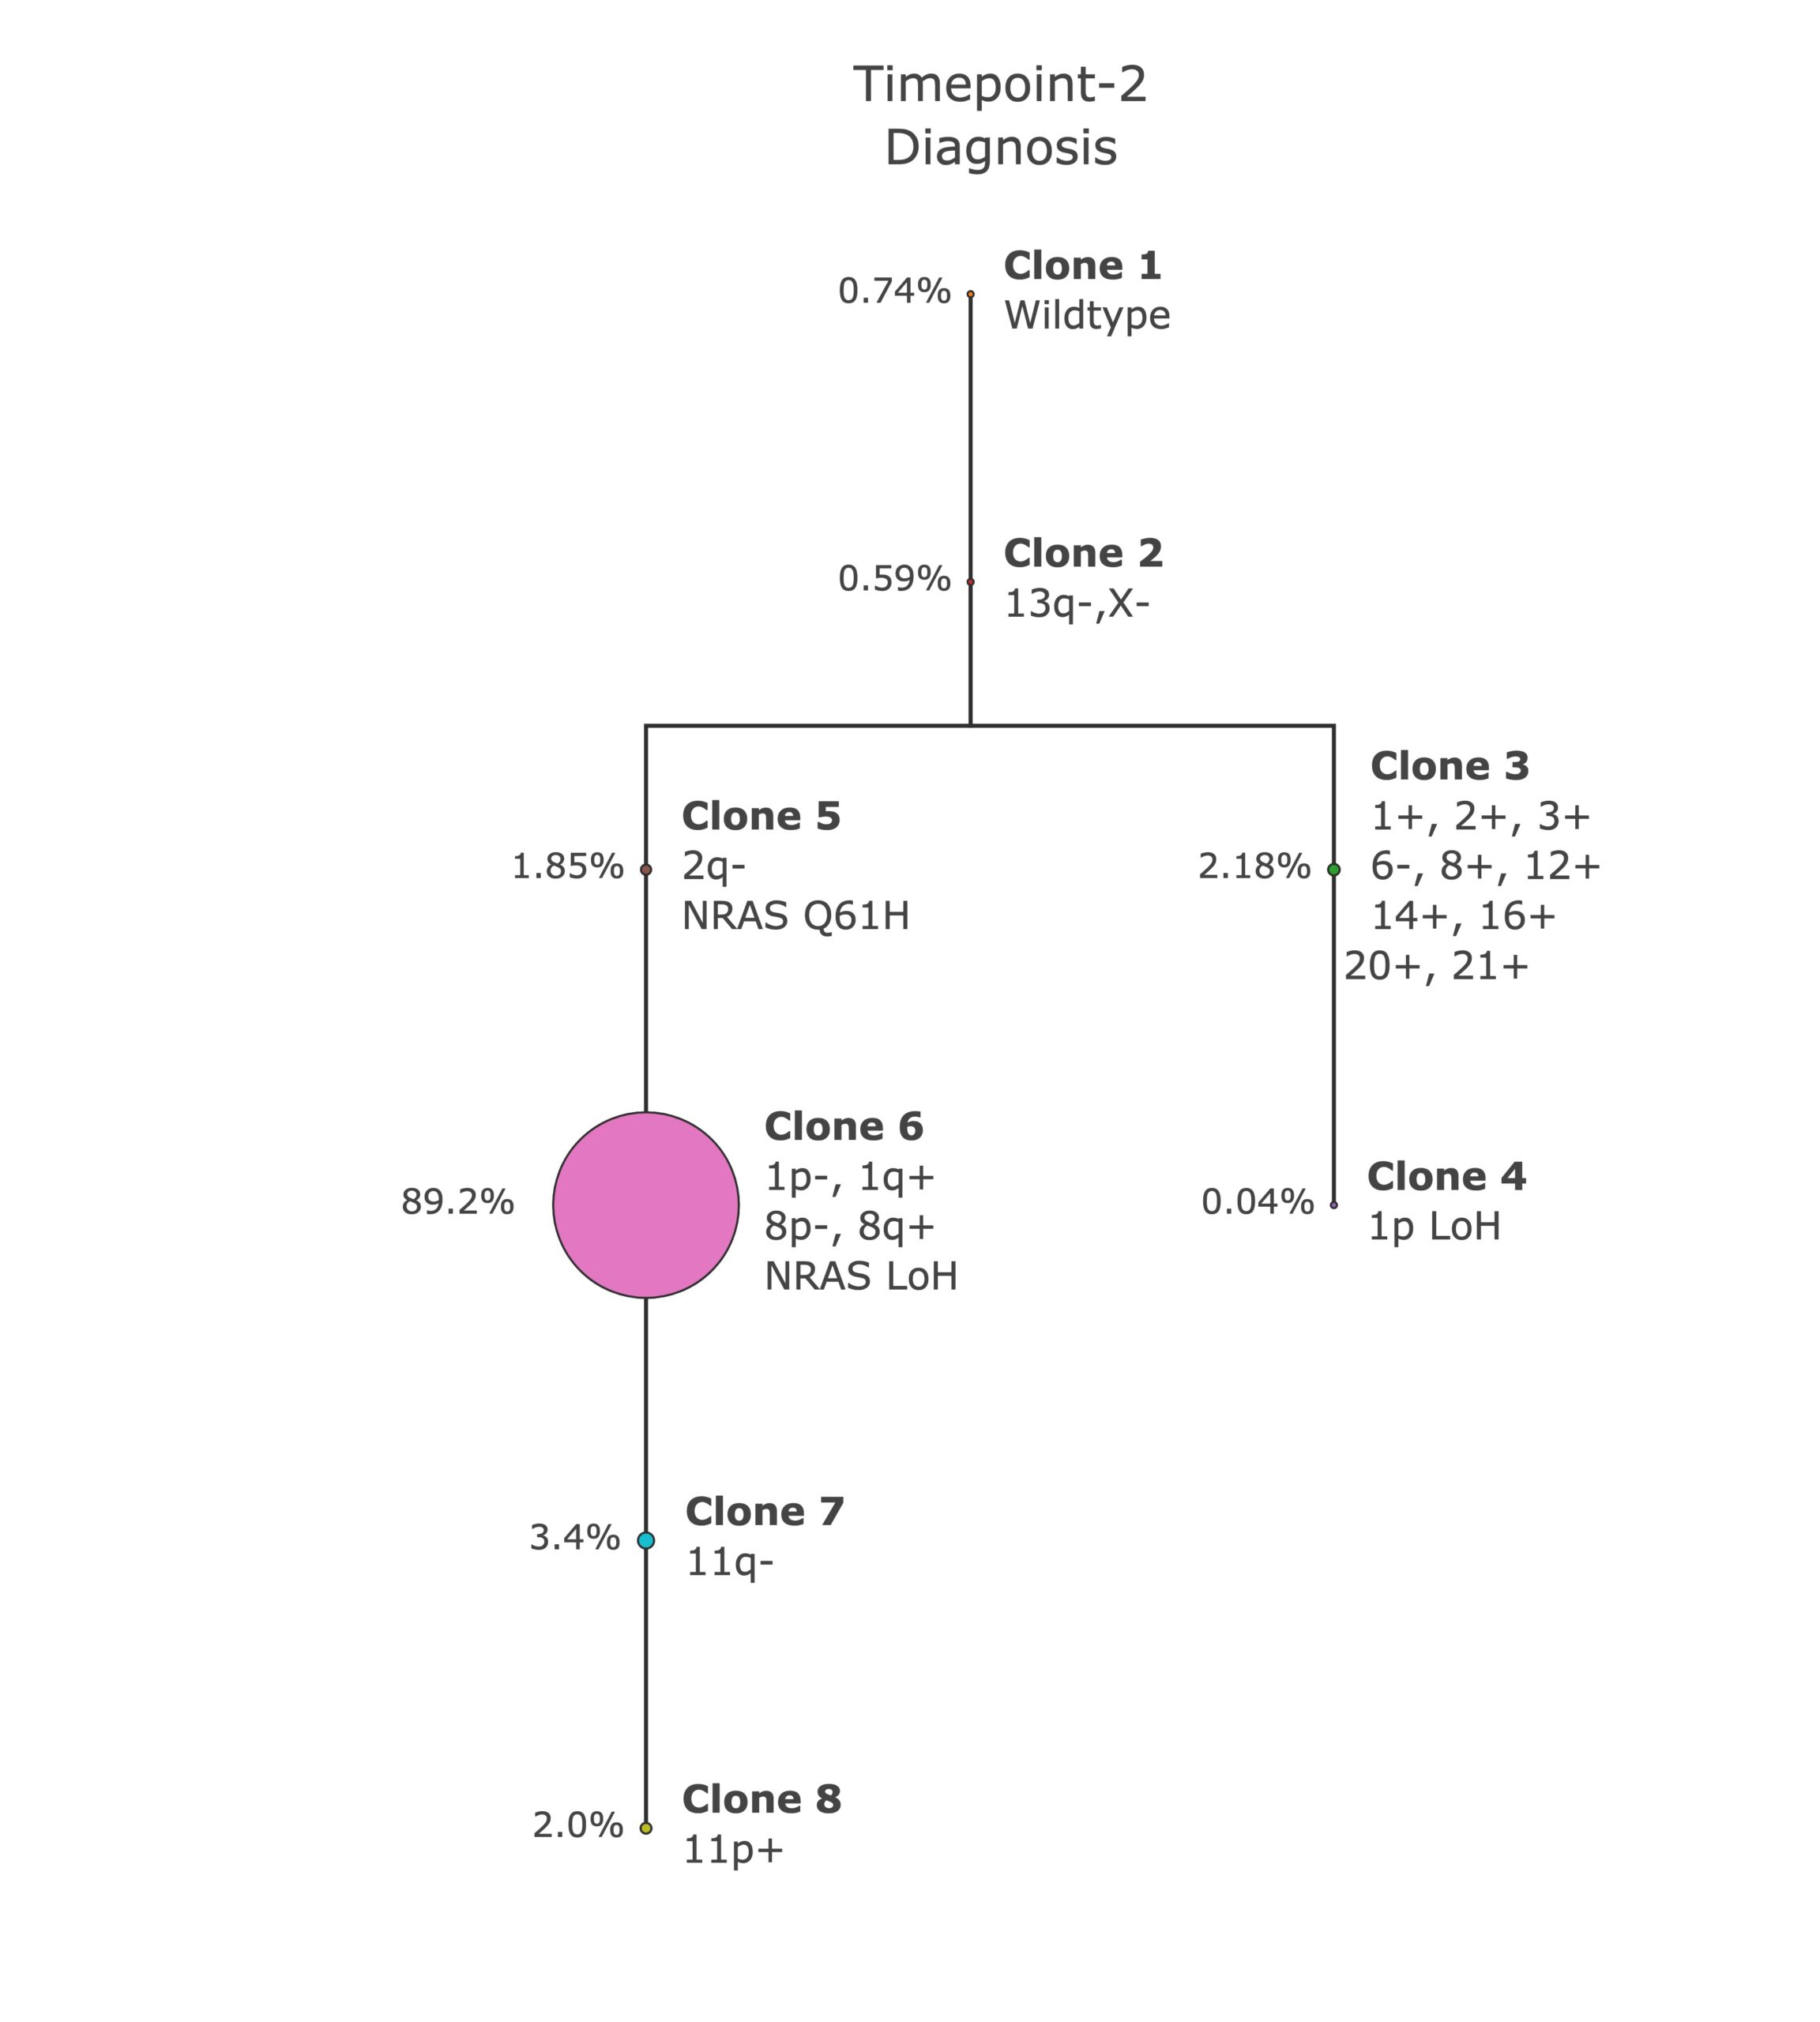
This clonal phylogenetic tree illustrates the evolutionary relationships and genomic alterations present in a patient sample at Timepoint-2 (Diagnosis), as resolved using the Mission Bio Tapestri® single-cell DNA sequencing platform.
Each branch represents a distinct genetically defined clone, annotated with:
- Percentage of cells in the total population (clonal fraction)
- Copy number changes (e.g., 13q deletion, 1p-/1q+)
- Point mutations (e.g., NRAS Q61H)
- Loss of heterozygosity (LoH) in key genomic regions
The visualization highlights:
- A dominant clone (Clone 6) comprising 89.2% of the sample, harboring multiple chromosomal alterations and NRAS LoH, suggesting clonal selection and expansion.
- Several minor subclones (e.g., Clones 1, 2, 3, 5) with discrete structural variants and mutations, indicating early diversification.
- A clear evolutionary trajectory from early wild-type or singly altered clones to the complex, aberrant dominant population.
Tapestri-powered single-cell phylogenetic reconstruction enables high-resolution insight into tumor heterogeneity and clonal fitness, supporting therapeutic risk stratification and molecular monitoring strategies.
Single-Cell Multi-Omic Profiling of 16 PBMC Patient Samples Using the Mosaic Cohort Analysis Pipeline
Figure: Single-Cell Multi-Omic Profiling Across 16 Patients with Plasma Cell Neoplasms
This figure showcases data from 16 patients with monoclonal gammopathies, including MGUS and smoldering multiple myeloma (SMM), analyzed using the Mission Bio Tapestri® Mosaic Cohort Analysis pipeline. Each patient’s sample is deconvoluted into genetically distinct clones, with integrated insights across DNA, protein, and structural features.
Key data layers include:
- Clonal Architecture:
Clonal fractions indicate the prevalence of each clone within a sample, revealing subclonal complexity and dominance patterns. - Genomic Features:
Includes immunoglobulin clonotypes (IGH, IGK, IGL), structural variants (e.g., del(1p), gain(1q), del(13q)), focal copy number variations (e.g., TP53, MYC), and somatic mutations (e.g., NRAS Q61H, KRAS G13D). - Surface Protein Expression:
Expression of 13 immunophenotypic markers (e.g., CD138, CD56, BCMA, GPRC5D) is profiled per clone, enabling functional linkage of genotype to phenotype and identification of therapeutic targets.
Overall significance:
This cohort analysis highlights the ability of Mission Bio’s single-cell multi-omics and single-cell bioinformatics to resolve disease heterogeneity, map clonal evolution, and assess clinically actionable features, supporting precision oncology efforts in plasma cell malignancies.

Get Started
Contact us to begin your evaluation
*The content provided herein may relate to products that have not been fully validated by Mission Bio and is subject to change without notice.
For Research Use Only. Not for use in diagnostic procedures.