Recently, we discussed the genomic diversity of Multiple Myeloma (MM), and how the precision of single-cell analysis can help untangle the implications of the many molecular signatures of this disease. Here we tackle some real-world data analysis of our MM study looking at MGUS and SMM time points, and what we can learn from it.
Multiple Myeloma Study Method
In this MM study, 20 pairs of matched SMM/MGUS and MM diagnostic samples were CD138-enriched and cryopreserved. The Tapestri Platform can process samples multiplexed together with germline genotype data – up to 3 samples can be pooled together in one run, and then demultiplexed using their germline SNPs. For this study, samples from each time point were multiplexed in groups of 3 on the Tapestri Platform, with an average of 3,500 cells per sample (averaging ~10,000 cells/run). These samples were then evaluated with the Tapestri Single-Cell Multiple Myeloma Multiomics Assay.
Example 1: Homozygous KRAS vs Hyperdiploidy
In our first example, let’s examine how zygosity can indicate clonal outgrowth. We have the clonal trees from the MGUS timepoint and the Diagnosis timepoint 13 months later.
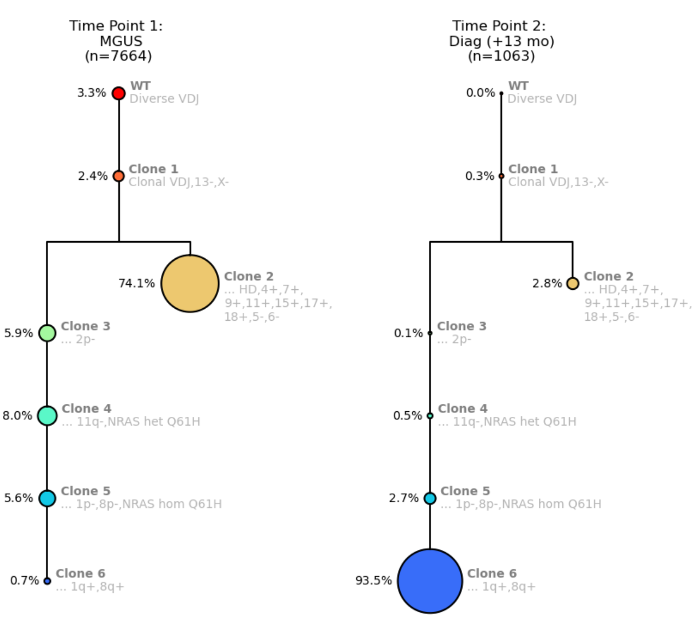
Figure 1. Clonal trees for a MM patient from Time Point 1: MGUS (left) and Time Point 2: MM Diagnosis (right).
The clonal trees show a branching pattern and start off with wildtype (WT) cells with diverse VDJ signatures Then, the founding clone (Clone 1) becomes clonal for VDJ with a del(13) and a del(X) (del(13) is a prognostic indicator). This clone then branches into Clone 2, a much larger clone with hyperdiploidy, with several gains but also losses of chromosome arms. The branched Clone 2 is now competing with the left arm of the tree where there are sequential loss of several arms.
On the left arm of the clonal tree, Clone 4 shows the acquisition of an NRAS mutation, Q61H. At Clone 5, due to del(1p), that NRAS mutation becomes homozygous because you essentially lose the wildtype copy. Clone 6 then gains 1q, which is another prognostic indicator.
You can see from Time Point 1 to Time Point 2, Clone 2 “shrinks” dramatically, which is due to being outcompeted by Clone 6, probably due to multiple attributes of Clone 6 that make it very fit including homozygous NRAS mutation, del(1p) and gain(1q).
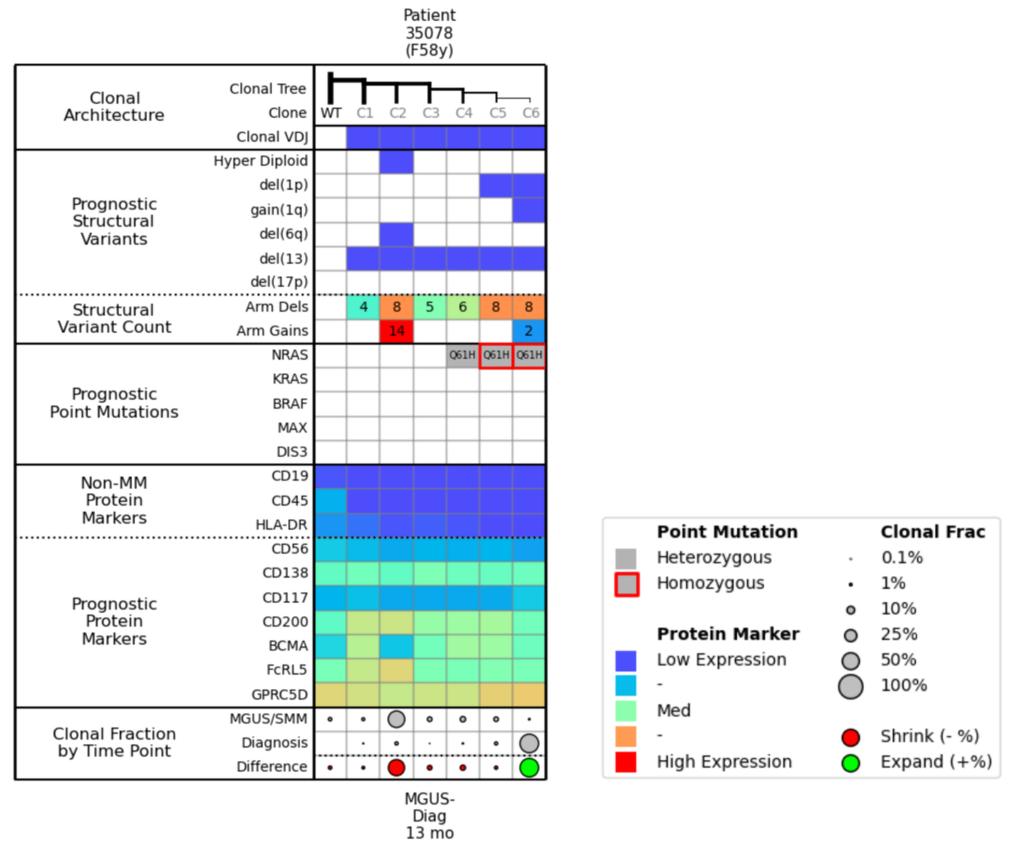
Figure 2. Molecular attributes table for Example 1.
Now let’s look at the corresponding molecular attributes table (Fig. 2) to pair with the clonal trees. In the Prognostic Structural Variants row, you can see that Clone 2 is a hyperdiploid with a large number of arm gains. The Clonal Fraction by Time Point row shows that the size of Clone 2 has diminished between the MGUS/SMM stage and the Diagnosis time point; this percent change is illustrated by the large red dot.
Clone 6 has del(1p) and gain(1q). In the Prognostic Point Mutations row, you can see how the NRAS mutation went from heterozygous to homozygous as 1p was deleted in Clone 6, and then scanning to the bottom of the chart, you see that Clone 6 is growing (as illustrated by the green dot).
It is important to note the prognostic protein markers in these clones. You see that Clone 2, which is the dominant clone at the MGUS/SMM time point, appears to have a low expression of BCMA. So if you were targeting Clone 6 with BCMA during the Diagnosis time point, you might expect Clone 2 to be the source of relapse, as the right arm of the clonal tree would recede due to the BCMA treatment and Clone 2 would dominate. However, Clone 2 is highly-expressing for FcRL5, which could be another potential target for treatment.
To summarize, Clone 6 with a homozygous NRAS mutation, del(1p), and gain(1q) outcompeted the formerly dominant hyperdiploid Clone 2 from MGUS. Clone 6 should be more responsive to BCMA therapy, while Clone 2 might be targetable by CD200/FcRL5 therapy.
Example 2: NRAS vs KRAS mutation
Let’s take a look at another example. In this example, there are two child clones—one has an NRAS mutation (Clone 4) and one has a KRAS mutation (Clone 3).
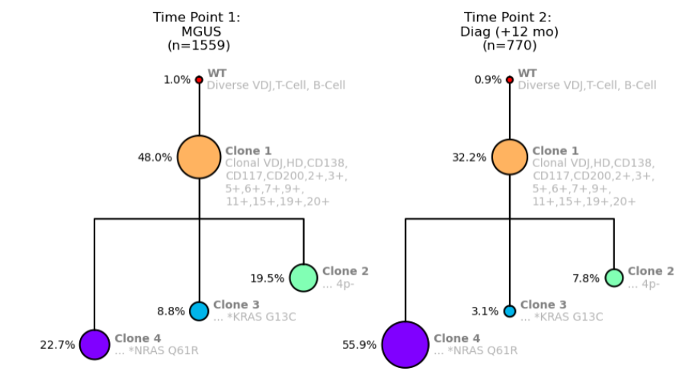
Figure 3. Clonal trees showing NRAS and KRAS mutations for a MM patient from Time Point 1: MGUS (left) and Time Point 2: MM Diagnosis (right).
As our assay revealed, the only difference between these two clones is the mutations NRAS and KRAS. Interestingly, we can now compare these two clones and see what happens.
As shown in Figure 3, Clone 4 with the NRAS mutation more than doubles in size between the MGUS and Diagnosis time points, whereas Clone 3 with the KRAS mutation is essentially halved in size.
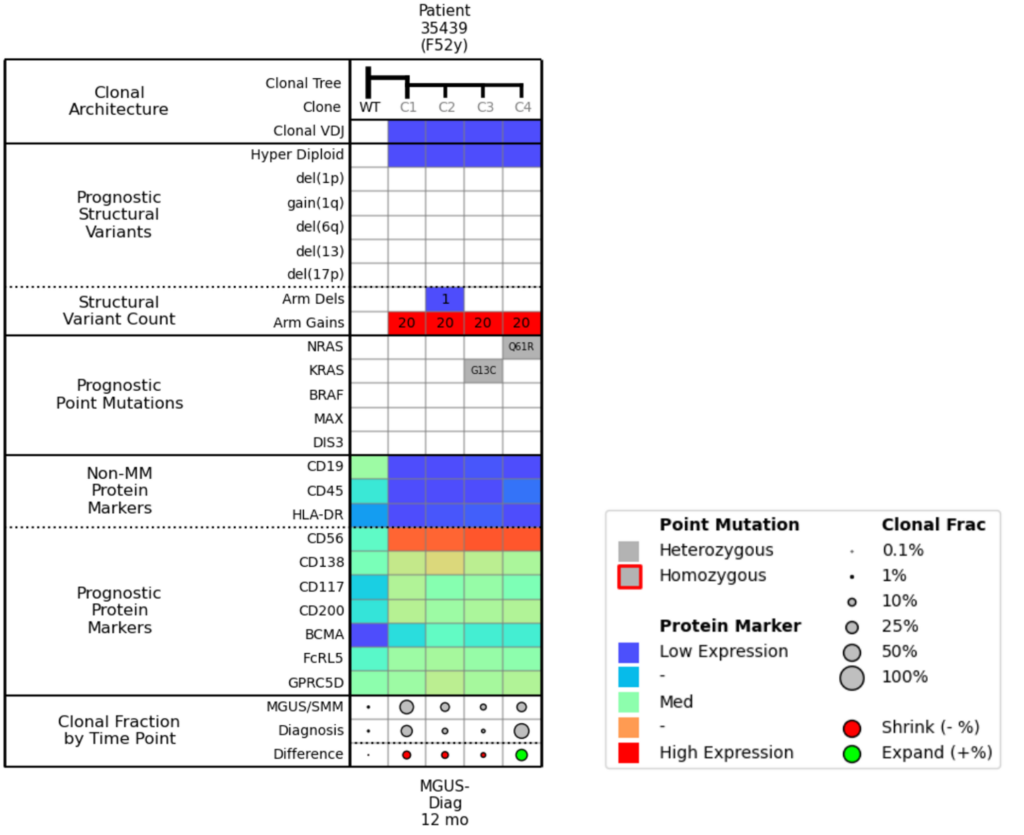
Figure 4. Molecular attribute table for Example 2.
When we compare Clone 3 and Clone 4 in the molecular attributes table (Fig. 4), the only difference between them is the NRAS and KRAS mutation. The Clonal Fraction by Time Point row shows that the KRAS mutation is shrinking, and the NRAS mutation is growing.
If we look at the protein markers, we see that all clones are positive for BCMA expression, which means that even though there is clonal diversity and differential populations, BCMA will likely be a good therapeutic target for this patient.
Example 3: Balance between BCMA-expressing Clones
Lastly, our third example begins with Time Point 1 at SMM, and Time Point 2 at Diagnosis 9 months later.
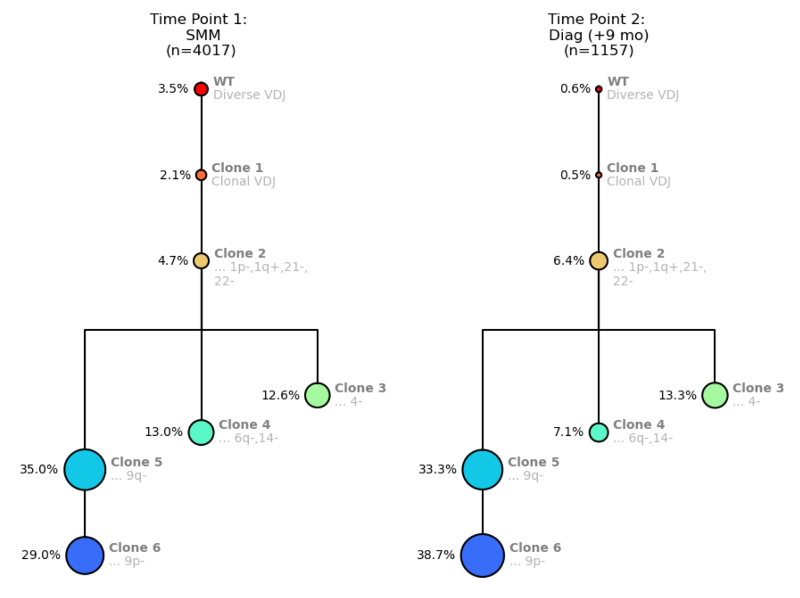
Figure 5. Clonal trees for a MM patient from Time Point 1: SMM (left) and Time Point 2: MM Diagnosis (right).
When scanning this attributes table (Fig. 6), you can see that Clones 4, 5, and 6 have higher BCMA expression, meaning they will likely be responsive to treatment, but that the other clones are not really changing over the 9 months. Between the SMM and Diagnosis time points, the population percentages of the more mutated clones do not alter much, which suggests similar fitness. You could anticipate that if you treated this patient with BCMA, Clones 4, 5, and 6 would shrink, and Clone 3 might be left to proliferate.
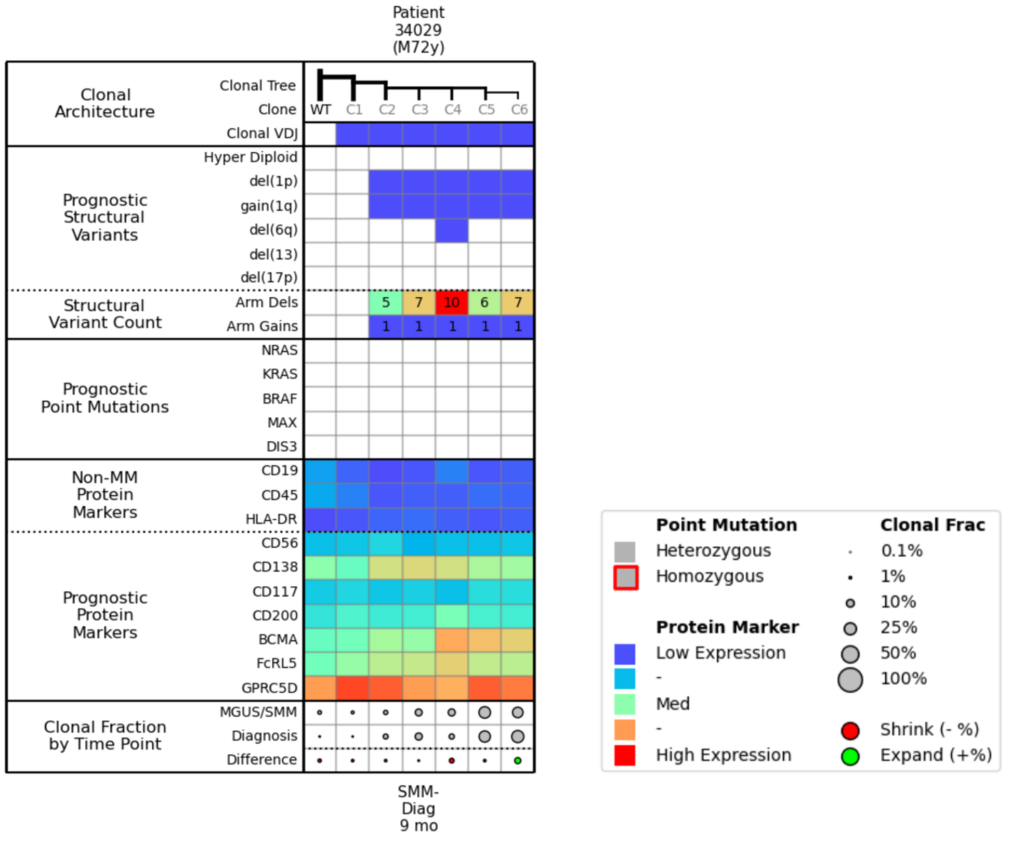
Figure 6. Molecular attributes table for Example 3.
Cohort-level Analysis
Here we’ve taken the 3 examples above and combined them into a large cohort analysis table. It’s helpful to begin by scanning the bottom row (Clonal Fraction by Time Point) where you can easily visualize the clones expanding (green dots) and shrinking (red dots) over time, and then assess the commonalities between the green dots and commonalities amongst the red dots. This example shows pre-treatment samples only; however, you can envision that, after a relapse or therapy, this type of analysis could help you understand why a treatment is working or not working across a cohort.
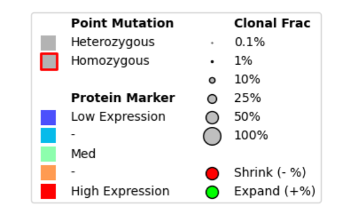
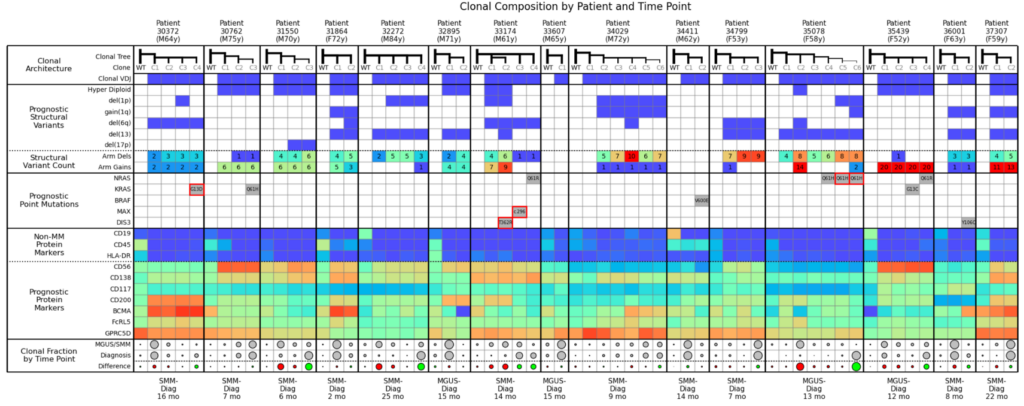
For example, in this cohort, you can see that NRAS Q61 is associated with expanding clones. The KRAS mutation also usually causes clones to expand, except for Example 2 where KRAS was competing with NRAS, and was outcompeted. While not explicitly shown in this table, in general, the more structural variants present, the more likely a clone is to expand.
From the perspective of MM therapy development, this level of cohort analysis is potentially invaluable to designing clinical studies, collecting and analyzing data, and interpreting results to guide clinical trials.
Guide Clinical Development with Cohort-Level Analysis
When it comes to drug development for multiple myeloma, cohort analysis can be instrumental in evaluating the efficacy and safety of new therapies. Cohort analysis can be used to:
- Define cohorts for inclusion or exclusion in clinical trial design
- Data collection and segmentation such as baseline data and dosage amount/frequency
- Interpreting effectiveness of groups on/off therapy and placebo groups
- Evaluating safety profile of drug
With the Tapestri, cohort-level analysis can be done at the single-cell level, providing a much higher resolution and confidence for the acceleration of therapeutic development.
The value of understanding clonal architecture
Understanding clonal architecture is invaluable for predicting disease progression and therapy response. Clonal architecture illustrates how samples are not homogenous but contain a diverse assortment of clones/subclones, and assessing those clones/subclones is essential for elucidating the mechanisms underlying myeloma progression, therapy response, and relapse.
Clonal architecture can also help inform the identification of novel biomarkers and the development of better therapies because amongst those disparate clones, there will be different levels of therapeutic targets and it may offer insight into alternate pathogenic variants that might cause those clones to expand.
Tapestri can characterize the features of clonal architecture that are hard to detect with bulk sequencing or flow cytometry. This includes:
- Low-frequency copy number events (down to 1%)
- Low-frequency homozygous mutations (down to 0.1%)
- Co-occurrence or mutual exclusion of those CNVs and SNVs within clones
- Corresponding expression change of prognostic/therapeutic markers
- Clonotype all subclones
Learn more about the Tapestri Single-cell Multiple Myeloma Multiomics Solution or watch Adam’s full multiple myeloma webinar here.
For Research Use Only. Not for use in diagnostic procedures.


