
In our recent webinar, Chief Technology Officer Adam Sciambi discussed the potential utility and application of single-cell DNA + protein multi-omics to accelerate clinical research, and the discovery and development of safer and more effective treatments for blood cancers. Here we recap his thoughts on single-cell multi-omics for clinical research and treatment, and dive into two use cases in Acute Myeloid Leukemia (AML) and Multiple Myeloma (MM).
Opportunities for Single-cell Analysis in Clinical Research and Treatment
When considering AML and MM, traditional assays like next generation sequencing (NGS) and flow cytometry can come up short in disease characterization, whereas the Tapestri platform can address these diseases in innovative ways.

Figure 1. Illustration of NGS and flow cytometry diagnostics in AML MRD and Multiple Myeloma.
The treatment of AML is approached with the goal of remission and then carefully monitored for Measurable Residual Disease (MRD) while looking for relapse during a quiet period. Figure 1 illustrates how the concordance of AML MRD testing using current assays has been incomplete. As illustrated, NGS and flow cytometry have a high rate of false negative and false positive occurrence. Due to the fragmented data and incomplete insights from these single-analyte approaches, it can be challenging to accurately predict relapse at an individual patient level, especially in cases lacking concordance between the two modalities.
On the other hand, MM is a chronic and branching disease, with branching clones that make it very difficult to permanently treat, so it requires ongoing treatment to ensure survival. With AML you are monitoring for recurrence, whereas with MM it is a constant battle of treatment. MM is not curable, and with each treatment, a different clone relapses. This presents a challenge because it’s difficult to know which clone will be relapsing – and, if that clone resurges, how to accurately treat it.
Prediction Errors by NGS and Flow for AML MRD
So why are the false positive and false negative rates so high when using bulk NGS and flow cytometry for AML MRD testing? Figure 2 highlights the sources of false negative and false positive rates for these two assays.
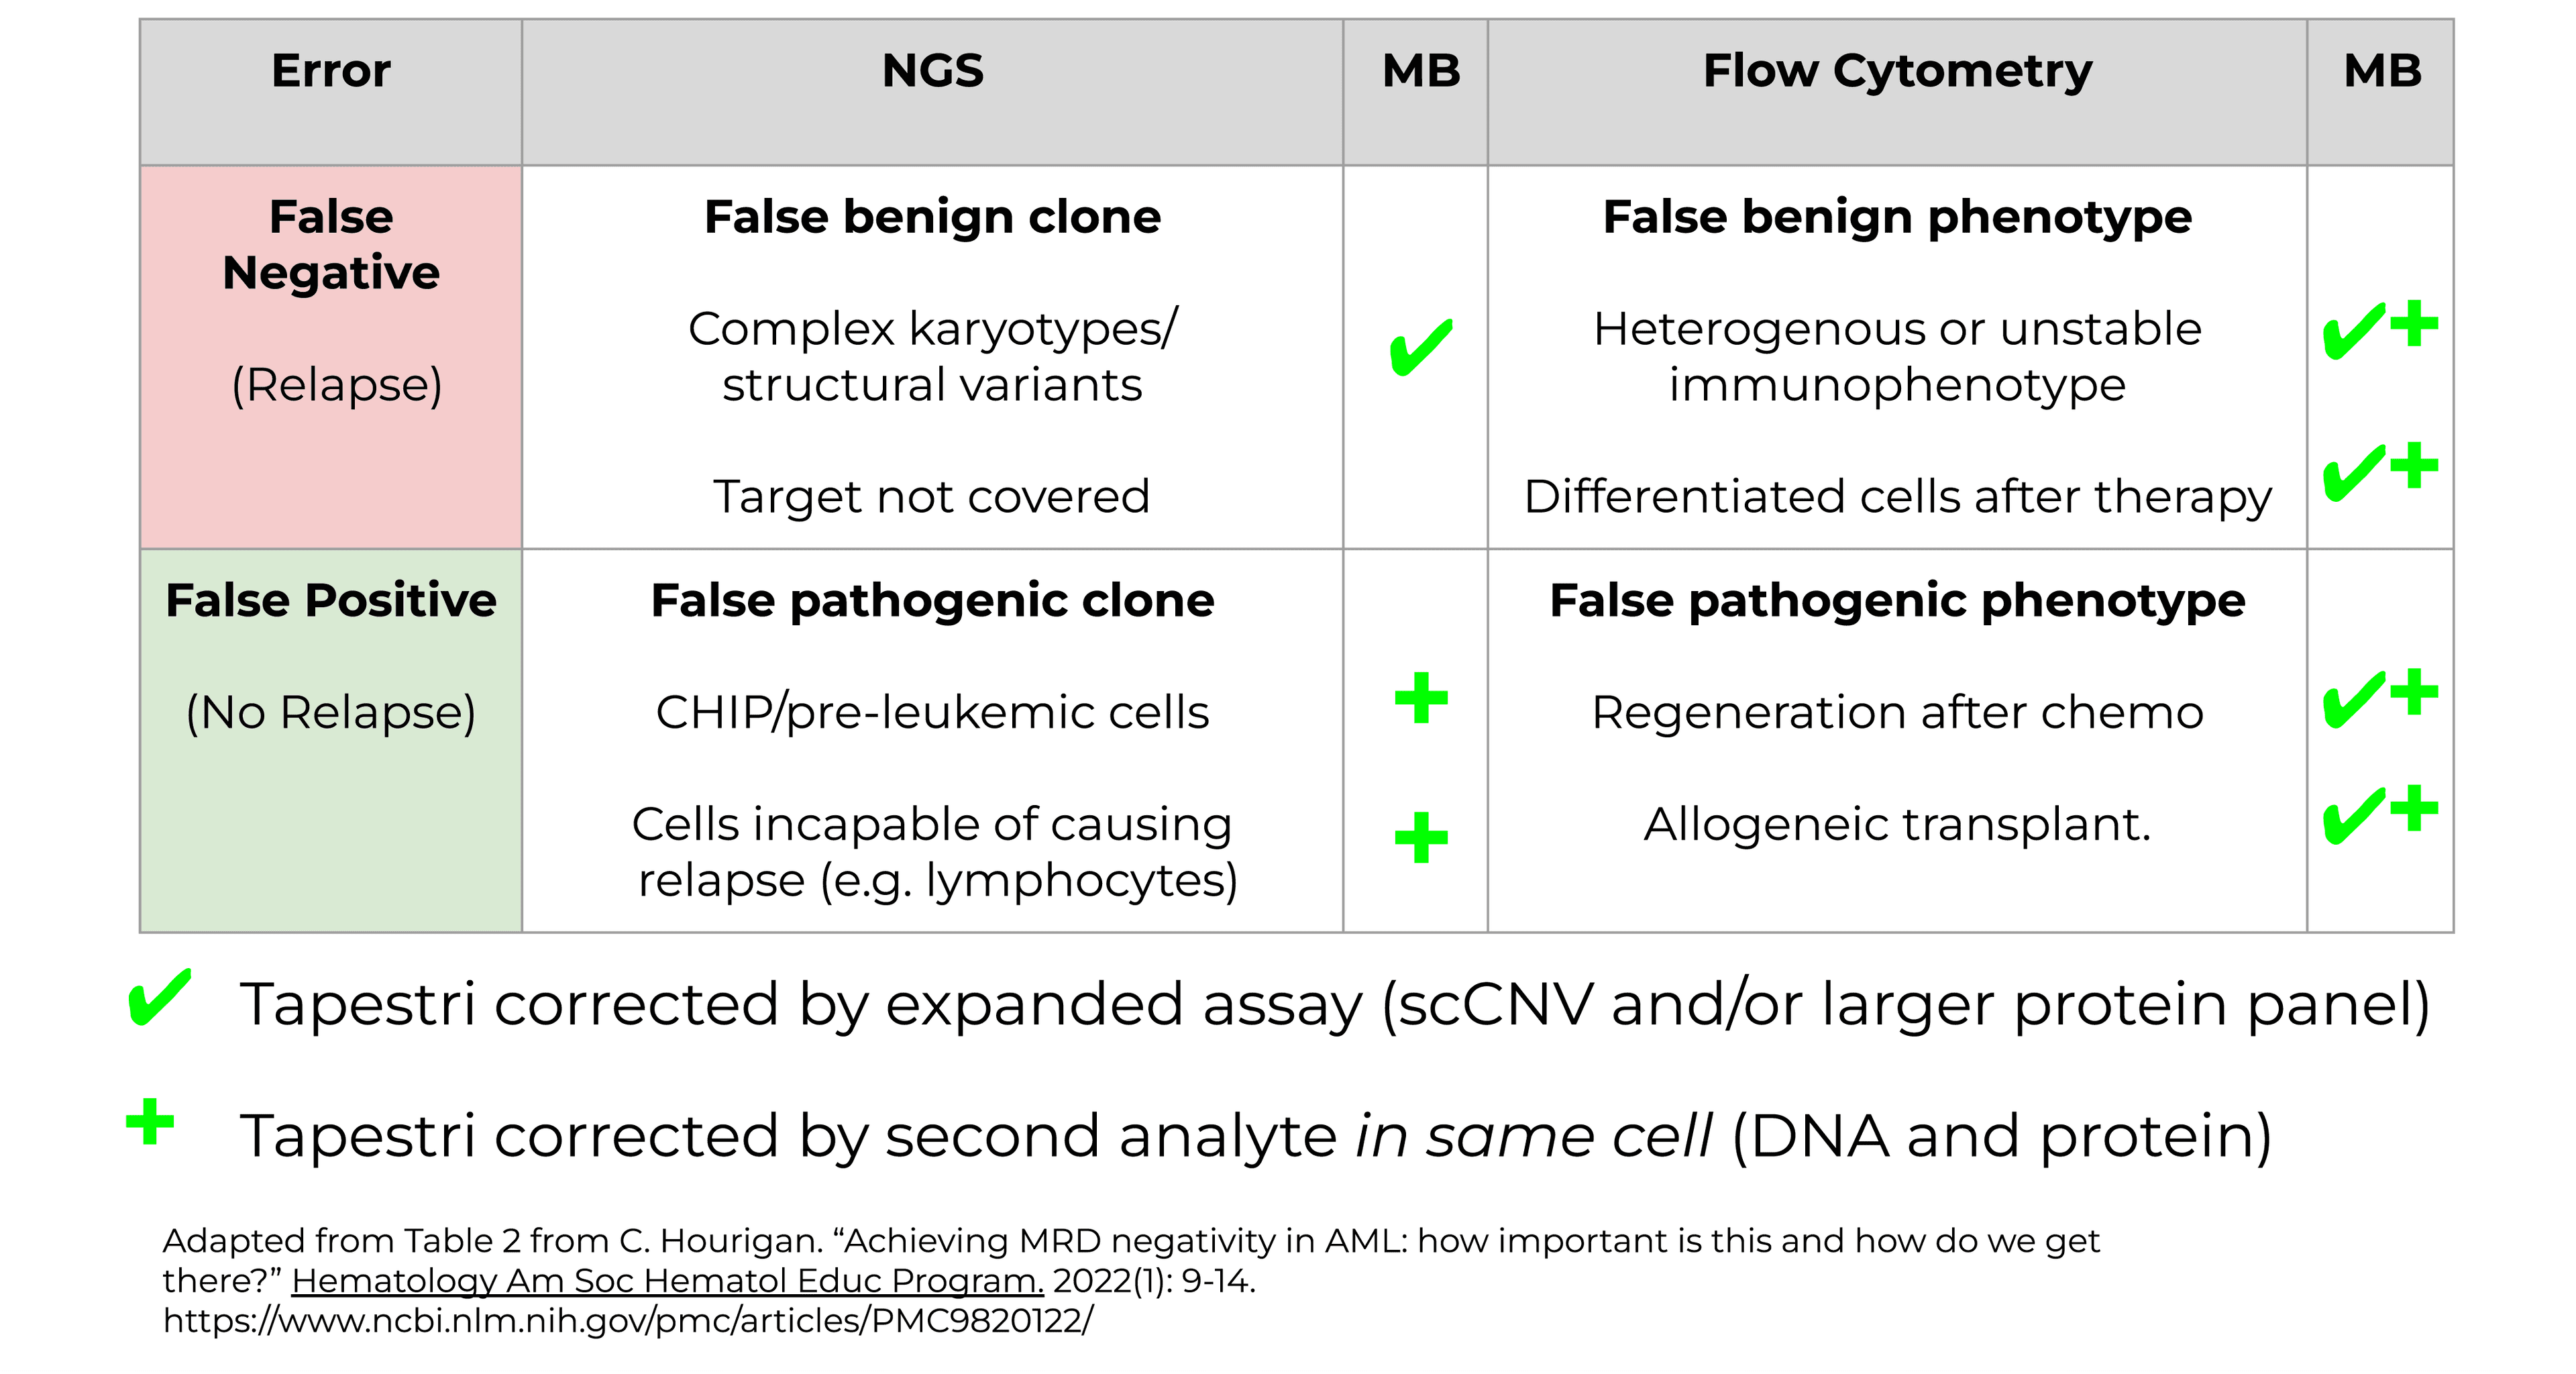
Figure 2. Prediction errors by NGS and flow cytometry for AML MRD.
False negative errors in NGS (Fig. 2, upper left) can occur when there are various genotypic features that are not picked up by NGS, such as complex karyotypes, or targets that are not covered by a panel.
When flow cytometry alone is used (Fig. 2, upper right), false negative errors often occur due to pathogenic mutations that do not express certain phenotypes either due to heterogeneous expression or differentiation of cells caused by therapy.
False positives from NGS (Fig. 2, lower left) may occur when pre-leukemic cells or CHIP clones are mistaken for recurrent cancer. Also, NGS cannot differentiate the cell types that harbor pathogenic mutations but are not capable of causing relapse, such as lymphocytes.
Finally, false positives from flow cytometry (Fig. 2, lower right) may occur following chemotherapy treatment when cells are regenerated, or during allogeneic transplants, where those cells may present with pathogenic phenotypes, whereas the cells are otherwise healthy.
AML MRD and the Tapestri Platform
In the landscape of all these false positives and false negatives, where can Mission bio come in? The Tapestri Platform can resolve this ambiguity through assays with high sensitivity and specificity. By having an expanded assay, such as single-cell copy number variant (scCNV), or a much larger protein panel that is typically used in flow cytometry, we’re able to resolve many of these false positive and false negative results. Additionally, Tapestri can provide high levels of specificity through analyzing a secondary analyte (DNA + protein). If you have a false positive from NGS, we’re able to look at the phenotypic signature in the same cell and confirm whether it’s positive or negative.
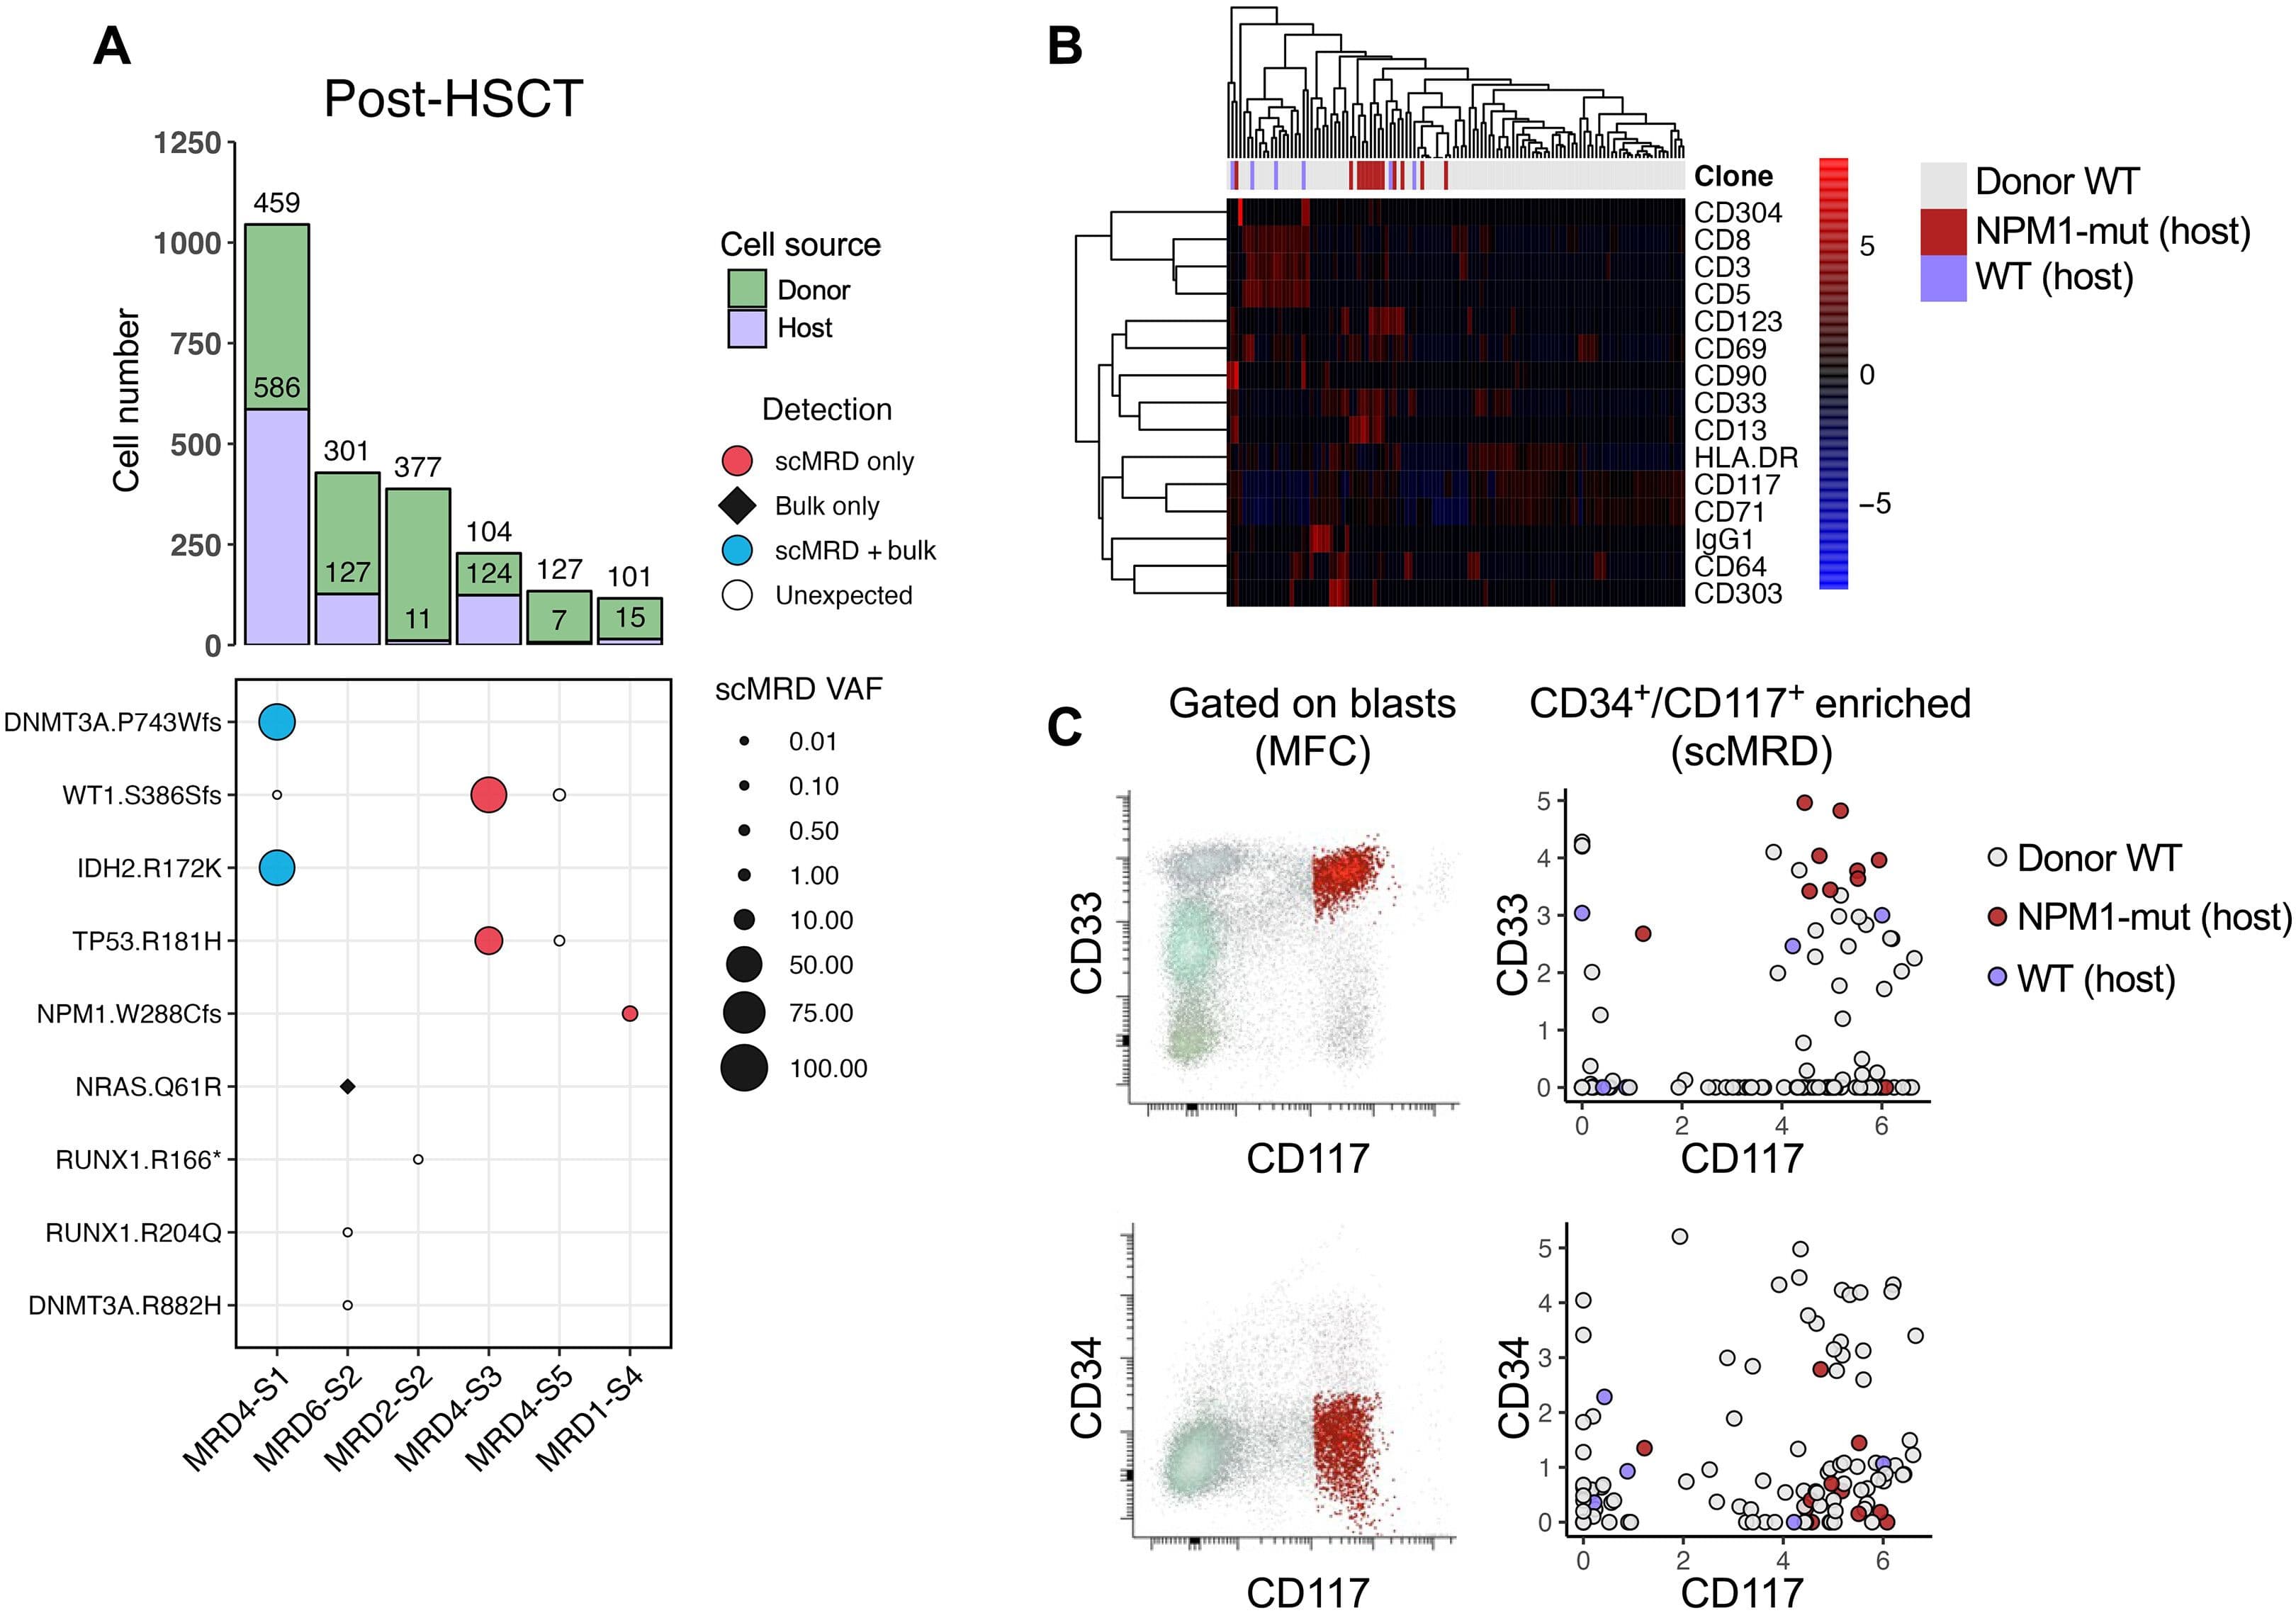
Figure 3. scDNA + Protein analysis enables simultaneous identification of donor cells and MRD. Robinson, et al. “Single-cell genotypic and phenotypic analysis of measurable residual disease in acute myeloid leukemia.” Science Advances (2023).
In this Science Advances paper by Robinson, et. al, researchers utilized the Tapestri scMRD Multi-omics Assay for AML, showing that there are variants that are detected by the Tapestri platform that were not detected by bulk sequencing. Researchers were also able to distinguish both the host cells from the donor cells (Fig. 3, right) and also within the host cells, distinguish wild type and mutant clones by protein. The scMRD Assay for AML provides a complete picture of very rare cells that ultimately should provide higher accuracy when detecting relapse.
Multiple Myeloma Complexity Complicates Treatment
When deciphering complex diseases like Multiple Myeloma, it can be difficult due to competing clones – anytime you knock out a clone, it becomes like a game of “whack-a-mole” attempting to eradicate additional clones that appear. Accurately identifying the clonal architecture of resistance mechanisms can help guide therapeutic approaches for MM. Here we review three instances of resistance that bulk NGS and flow cytometry can’t accurately distinguish – but the Tapestri platform can.
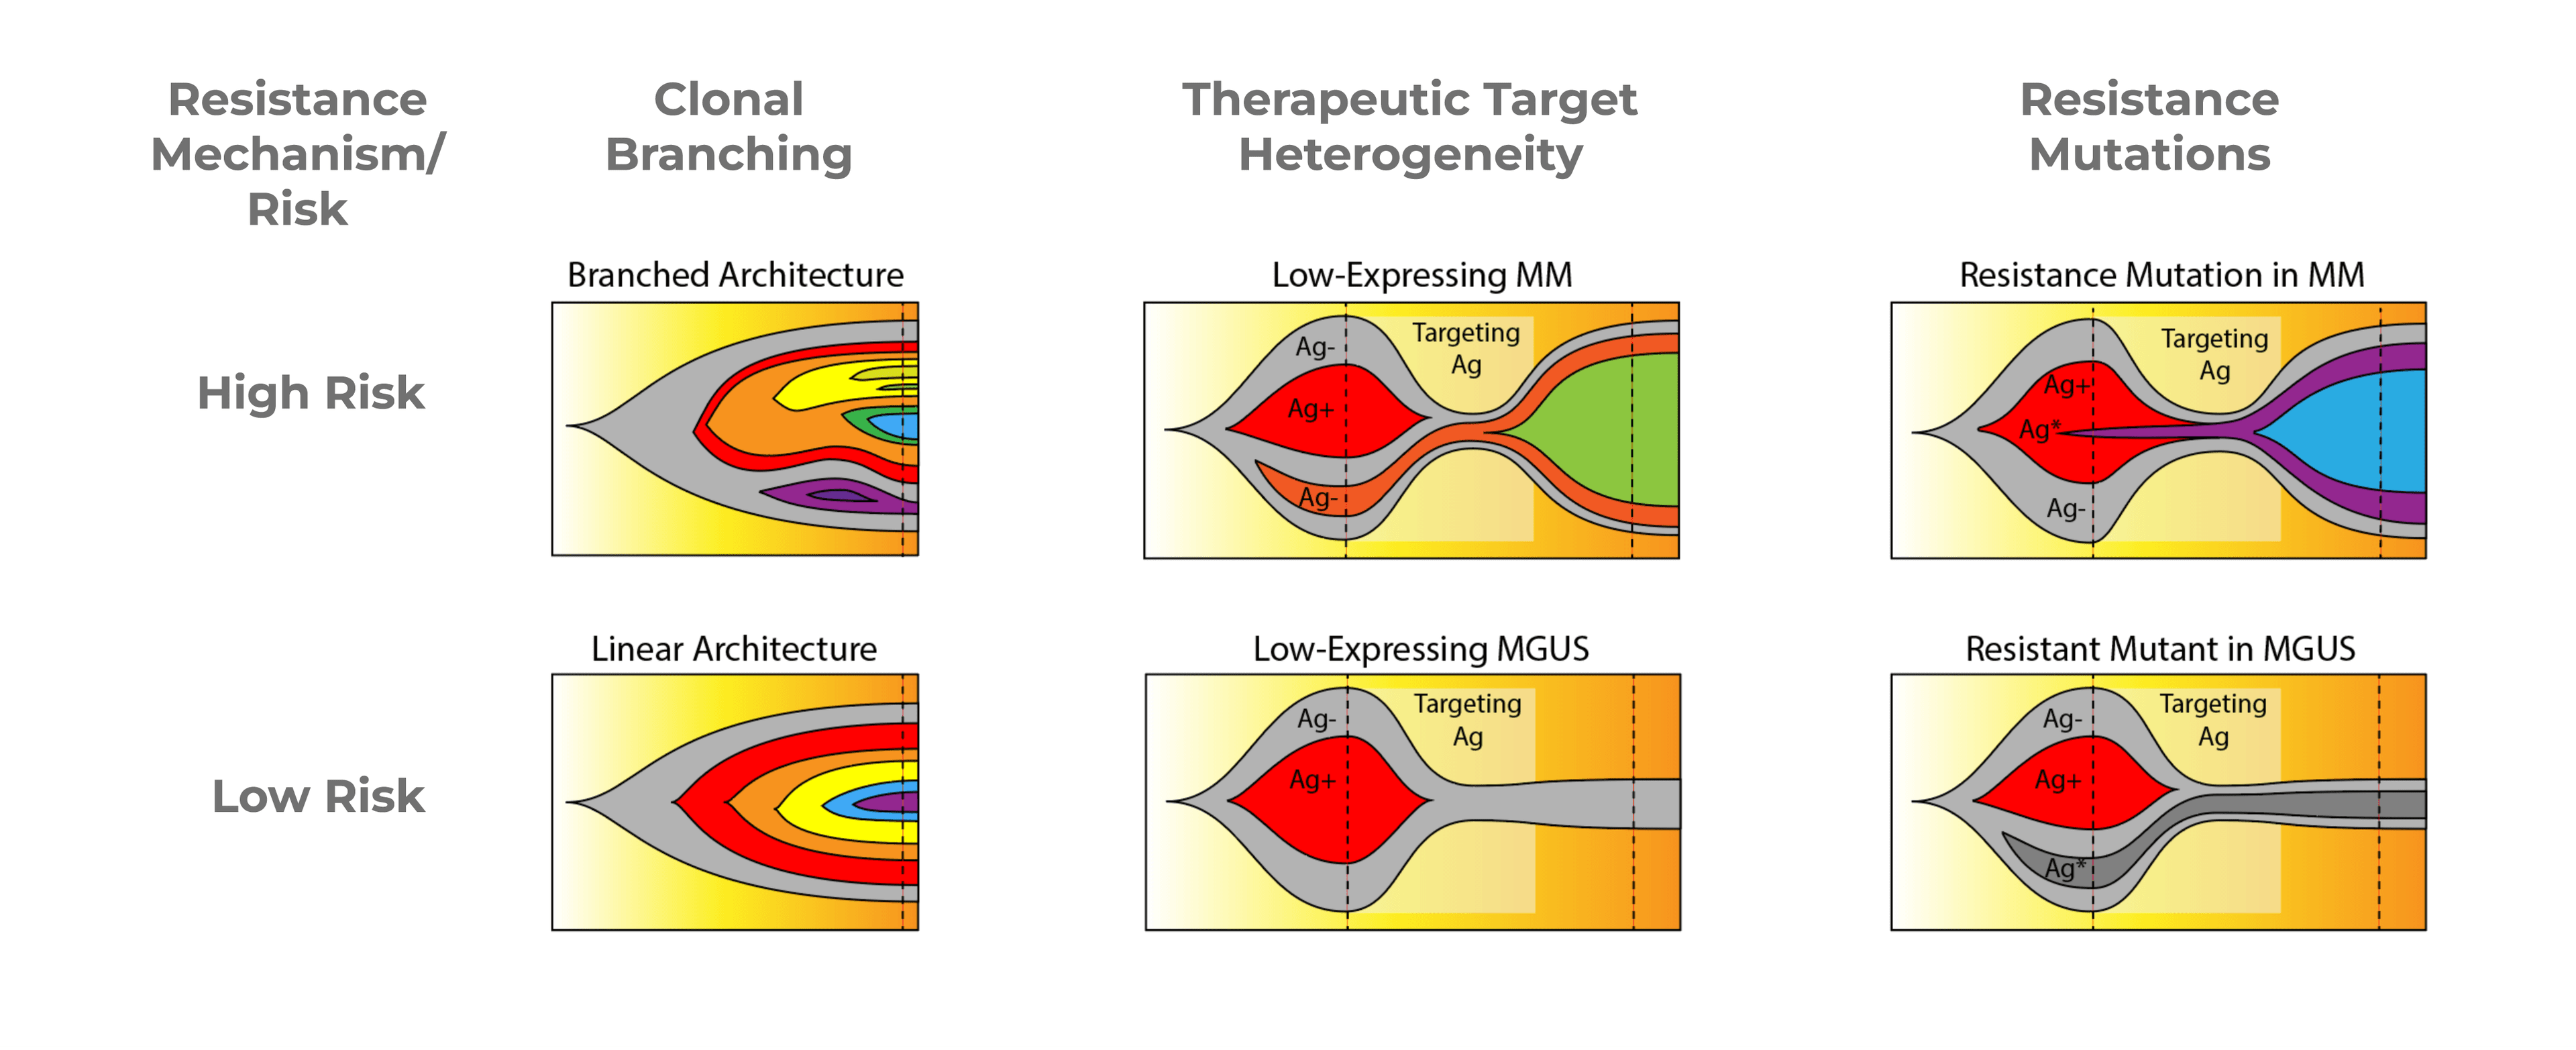
Figure 4. Fish plots illustrating resistance mechanisms in Multiple Myeloma.
Clonal Branching
The first resistance mechanism is Clonal Branching (Fig 4, left). In the high-risk condition, you can see on the fish plot that there are many different branched subclones, which can compete with each other. The low-risk fish plot shows a single linear architecture where each clone is nested under the one prior to it. In treating clonal branching, the high-risk version will be much harder to treat entirely because any particular treatment may only knock out a few branches, thus creating space for outgrowth of other branches.
Therapeutic Target Heterogeneity
When treating multiple myeloma with a therapeutic target, it can be difficult to distinguish between low-risk and high-risk with NGS or flow cytometry. It’s hard to determine if low-expressing cells for that therapeutic target are healthy cells, precursor cells, such as CHIP, or if they’re actually low-expressing multiple myeloma cells which will then expand during treatment.
In the High-Risk fishplot (Fig 4, center), you can see that the orange population, which is antigen-negative, during treatment, is the population that expands despite the antigen-positive multiple myeloma population shrinking. This is difficult to distinguish from the Low-Risk plot where you see that the only antigen-negative cells are the background wild type cells or the CHIP cells. And in that case, the patient actually responds better to treatment and the pre-cancer cells then reach a stable background.
Resistance Mutations
Lastly, resistance mutations (Fig. 4, right) may be detected by NGS, but it’s difficult to determine if it is part of the multiple myeloma disease, a precancerous phase, or MGUS phase. During treatment, the resistant clone (purple) is able to expand, whereas on the Low-Risk fishplot, the disease is actually fairly responsive to treatment, and the resistant mutation, which is in MGUS, just sort of lingers, but doesn’t ultimately expand. With these different cases, it’s very hard to distinguish the high-risk and low-risk cases with NGS and flow.
Multiple Myeloma Time Points on Tapestri
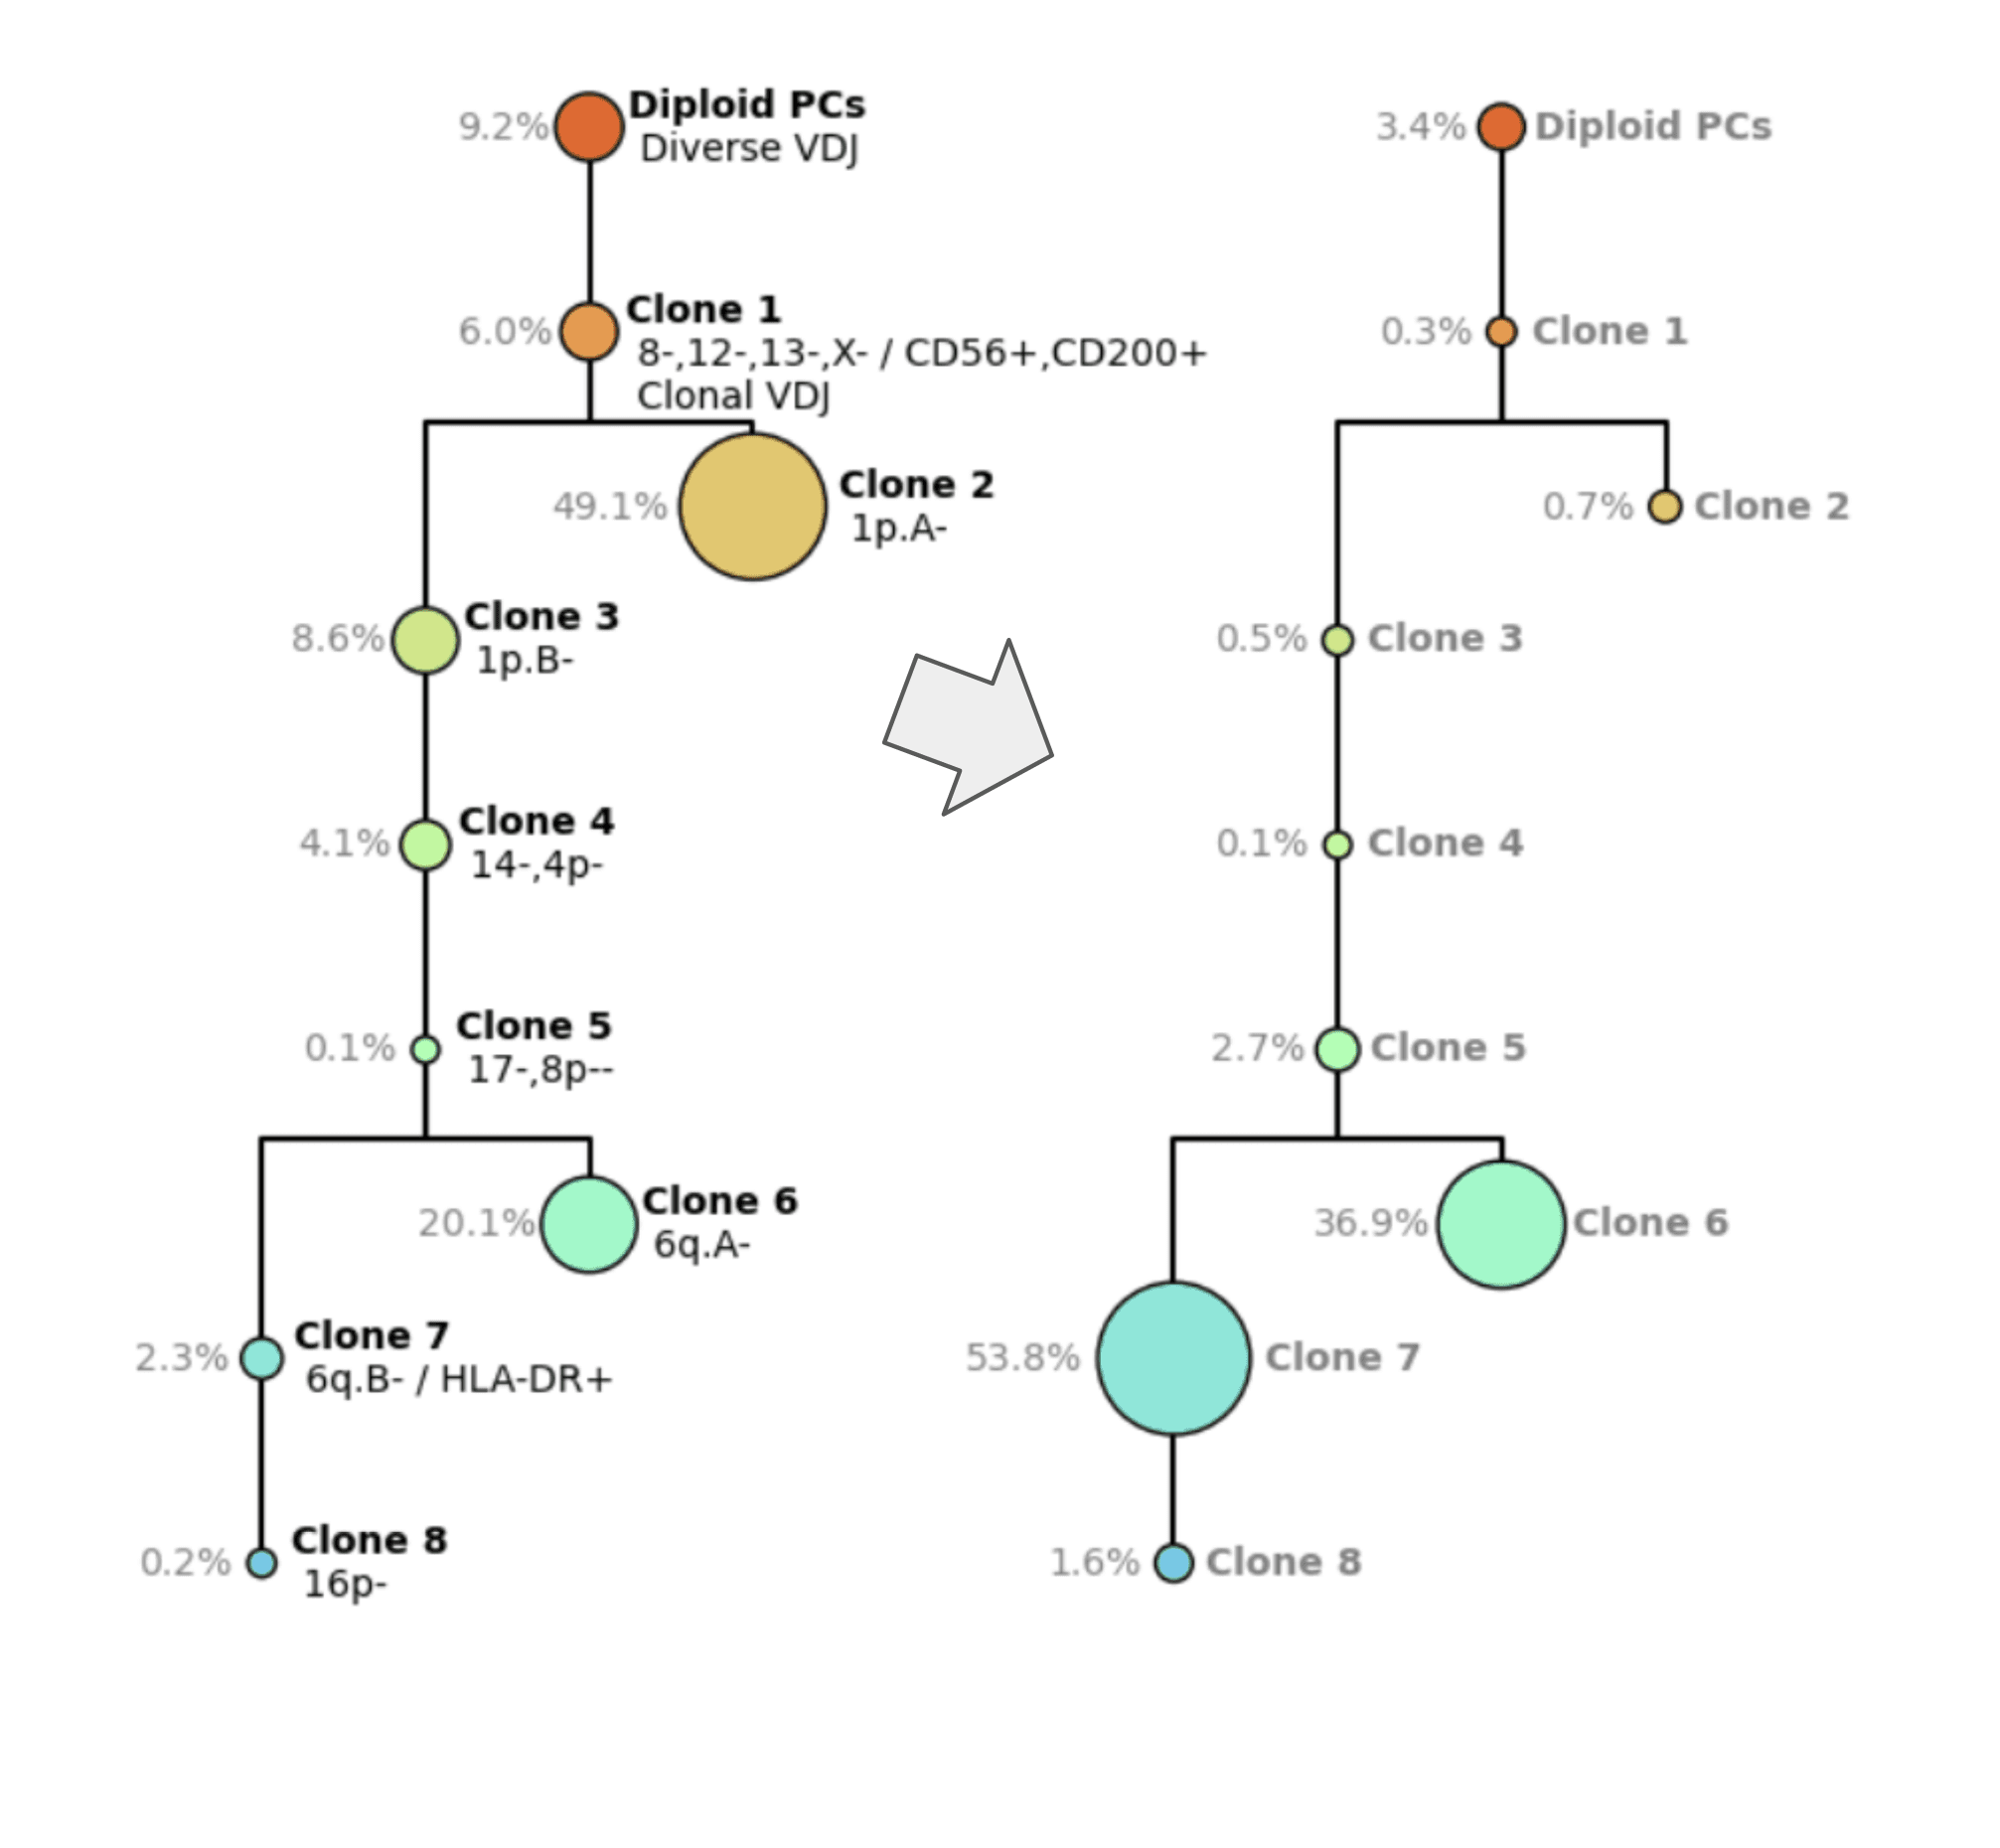
Figure 5. Smoldering Multiple Myeloma tree (left) and Multiple Myeloma diagnostic tree (right)
The Tapestri platform helps elucidate the clonal architecture of complex diseases like Multiple Myeloma. Figure 5 depicts two clonal architecture trees from the same patient at different time points. On the left (Fig 5., left) you see the clonal tree from smoldering multiple myeloma, which is an earlier phase of the disease. On the right (Fig. 5, right), you have the diagnostic time point, where you can see a very complex structure with multiple different clones. Clones on the MM diagnostic tree are characterized by clonotype, VDJ, copy number, the chromosome arms that were gained or lost, and also protein expression.
For example, Clone 1 (orange) has a loss of Copy 8, 12, 13, and x, has a higher expression of CD56 and CD200, and has clonal VDJ, unlike the healthy cells above it.
You can see post-treatment that Clone 2 becomes smaller and Clone 6 and Clone 7 expand. This is very hard to predict but with the Tapestri platform, you’re not only able to discern these rare or disparate subclones but able to track how they respond.
Utilizing Single-Cell for Research and Development
Single-cell DNA multi-omics has the potential to accelerate clinical research and discovery and development of safer and more effective treatments for blood cancers. AML and Multiple Myeloma are just two use cases where the Tapestri platform can better characterize rare cells so that you can more accurately predict relapse by combining the genotype and phenotype, in addition to sensitivity. These assays are better able to guide therapy due to the ability to distinguish the complex diversity of the clones, with the potential to guide and impact the development of future therapies.


