At this year’s World CB & CDx EU conference, we had the pleasure of meeting some of Europe’s top industry leaders in pharma and biopharma. Our own Gema Fuerte, Associate Director of Scientific Affairs, presented to a packed crowd. Here we recap Gema’s presentation.
Unraveling the Complexity of Cancer Evolution & Therapy Response
Gema kicked things off by introducing the Tapestri Platform, a single-cell multiomics technology, which specializes in DNA analysis at the single-cell level to unravel the complexity of cancer. The Tapestri technology excels in identifying clonal heterogeneity within cancer masses by analyzing somatic mutations, copy number variations, translocations, and immunophenotypes, thereby facilitating a deeper understanding of therapeutic resistance, potential relapse, and early disease detection.
Clonal Evolution of AML Revealed
Gema first highlighted the power of the Tapestri Platform through the example of tracking treatment response in an acute myeloid leukemia (AML) patient by identifying resistant clones and their mechanisms. The Tapestri platform is capable of profiling single cell DNA and immunophenotypes, offering insights similar to bulk next-generation sequencing and flow cytometry, but at a more granular level, with a primary focus on oncology.
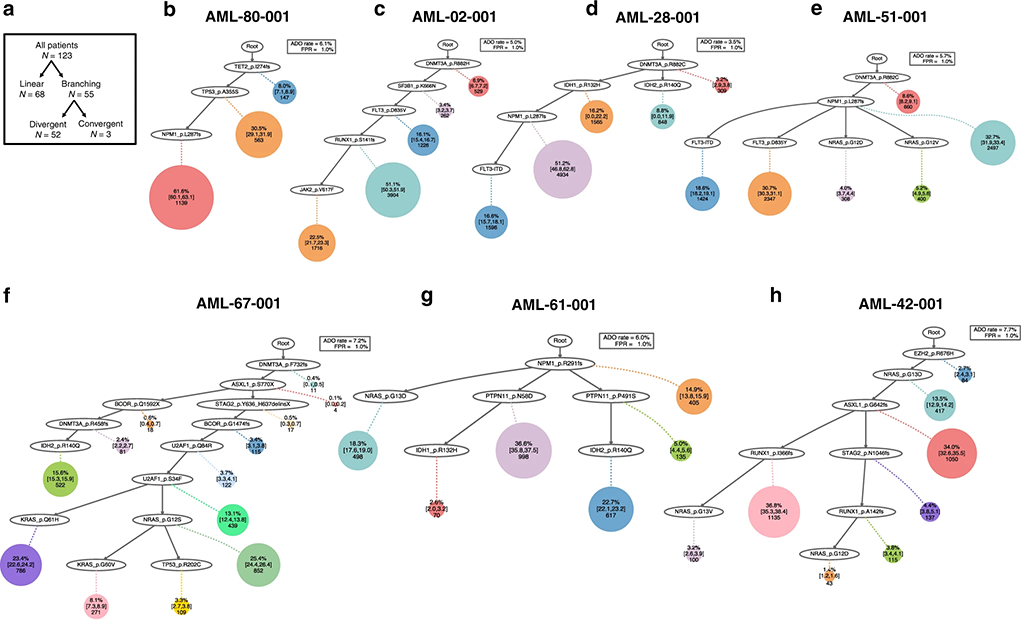
A study published in Nature Communications showcases the platform’s utility in dissecting acute myeloid leukemia at the single-cell level, demonstrating how patient stratification based on disease evolution can influence treatment outcomes. By examining over 500,000 cells from 77 patients, the study uncovered the impact of linear versus branched evolutions on treatment success, emphasizing the superiority of single-cell analysis over bulk sequencing for accurate mutation pathway mapping and relapse prediction.

Fig. 1. Examples of linear (top row) and branching (bottom row) clonal evolution patterns in AML.
Strategic Monitoring of Multiple Myeloma Markers
Later in her presentation, Gema discussed genomic analyses in various cancers, highlighting the role of clonal switching in treatment resistance and patient stratification, as seen in cases of multiple myeloma (MM) and solid tumors like breast cancer. Multiple Myeloma data shared at last year’s ASH conference illustrates how rich branching architecture was inferred by comparing copy number and SNVs against in-sample, healthy plasma cells. Additionally, several new capabilities were demonstrated in this study including therapeutic MM marker expression (e.g. FcRL5, GPRC5D, BCMA) were tracked and correlated with clonal evolution, clonotyping revealed a transition from diverse to clonal VDJ sequence with MM onset, and comparing sample time points showed a shift in clonal population distributions with disease maturation.
Understanding Therapeutic Resistance: Clonal Architecture of Ivosidenib Monotherapy
Lastly, Gema underscored the value of single-cell sequencing in detecting low-frequency mutations such as IDH2, crucial for understanding tumor evolution and informing clinical trial strategies.
IDH1 mutations occur in 6-10% of patients with AML, and Agios Pharmaceuticals (now Servier) makes Ivosidenib, a potent inhibitor of mutant IDH1, that was approved by the FDA in 2018 to treat patients with relapsed/refractory (RR) AML. In a follow-up to a previous clinical trial in 2018, they next looked at the molecular mechanisms underlying resistance and relapse in a subset of the patients that did not respond to ivosidenib monotherapy. Researchers utilized single-cell DNA sequencing using a 19-gene AML panel on matched baseline and relapse peripheral blood mononuclear cell sample pairs from 9 patients who had a response to ivosidenib followed by emergence of mIDH2.
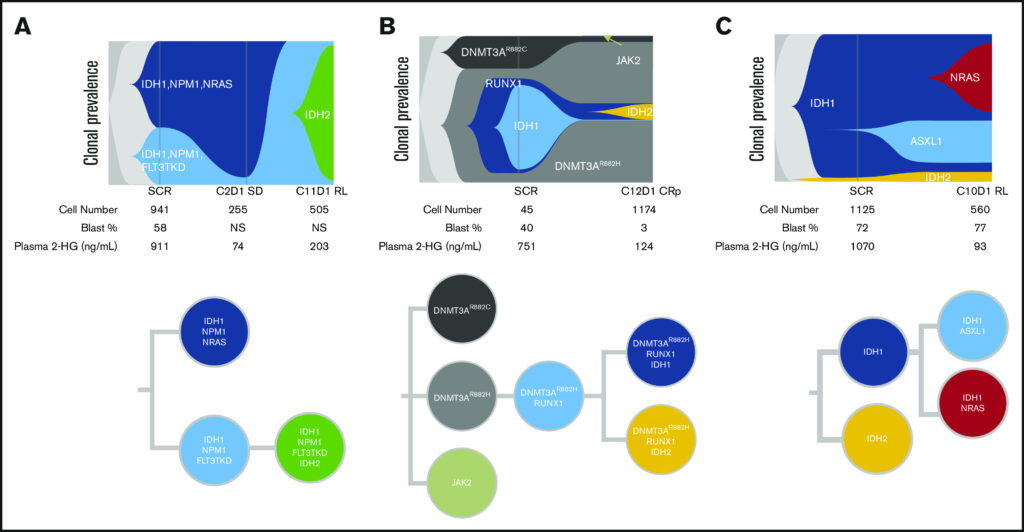
The researchers found high response rate and durable remissions were typically associated with NPM1 and IDH2, however, in cases of adaptive resistance (remission followed by relapse), NPM1 and IDH1 were also observed. Single-cell DNA sequencing revealed different complex clonal architectures of these co-occurring mutations.

Fig. 2. Single-cell analysis showing clonal evolution in individual patients. A. IDH1/IDH2 co-occurring mutations (6/9), B. IDH1/IDH2 isoform switching (1/9), C. Detectable IDH2 at baseline that was missed by bulk (1/9)
For more detailed information, check out Gema’s full presentation here.


