
Mission Bio is committed to helping you learn about single-cell DNA sequencing and multi-omics and how these exciting technologies are advancing medical science. Enjoy exploring our education hub!
CANCER & SINGLE-CELL ANALYSIS
Single-cell Sequencing Applications in Cancer
Translational research is the bridge that links fundamental discovery to clinical application. Profiling cancer leads to many advancements, including biomarker discovery and characterizing disease processes. This information lends insight into how we can better detect and surveil disease, segment patients into clinical trials, and combat resistance to therapies. Here, we outline four salient single-cell sequencing applications in cancer research: tumor evolution, therapeutic resistance, minimal residual disease (MRD), and clonal hematopoiesis of indeterminate potential (CHIP).
Tumor Evolution
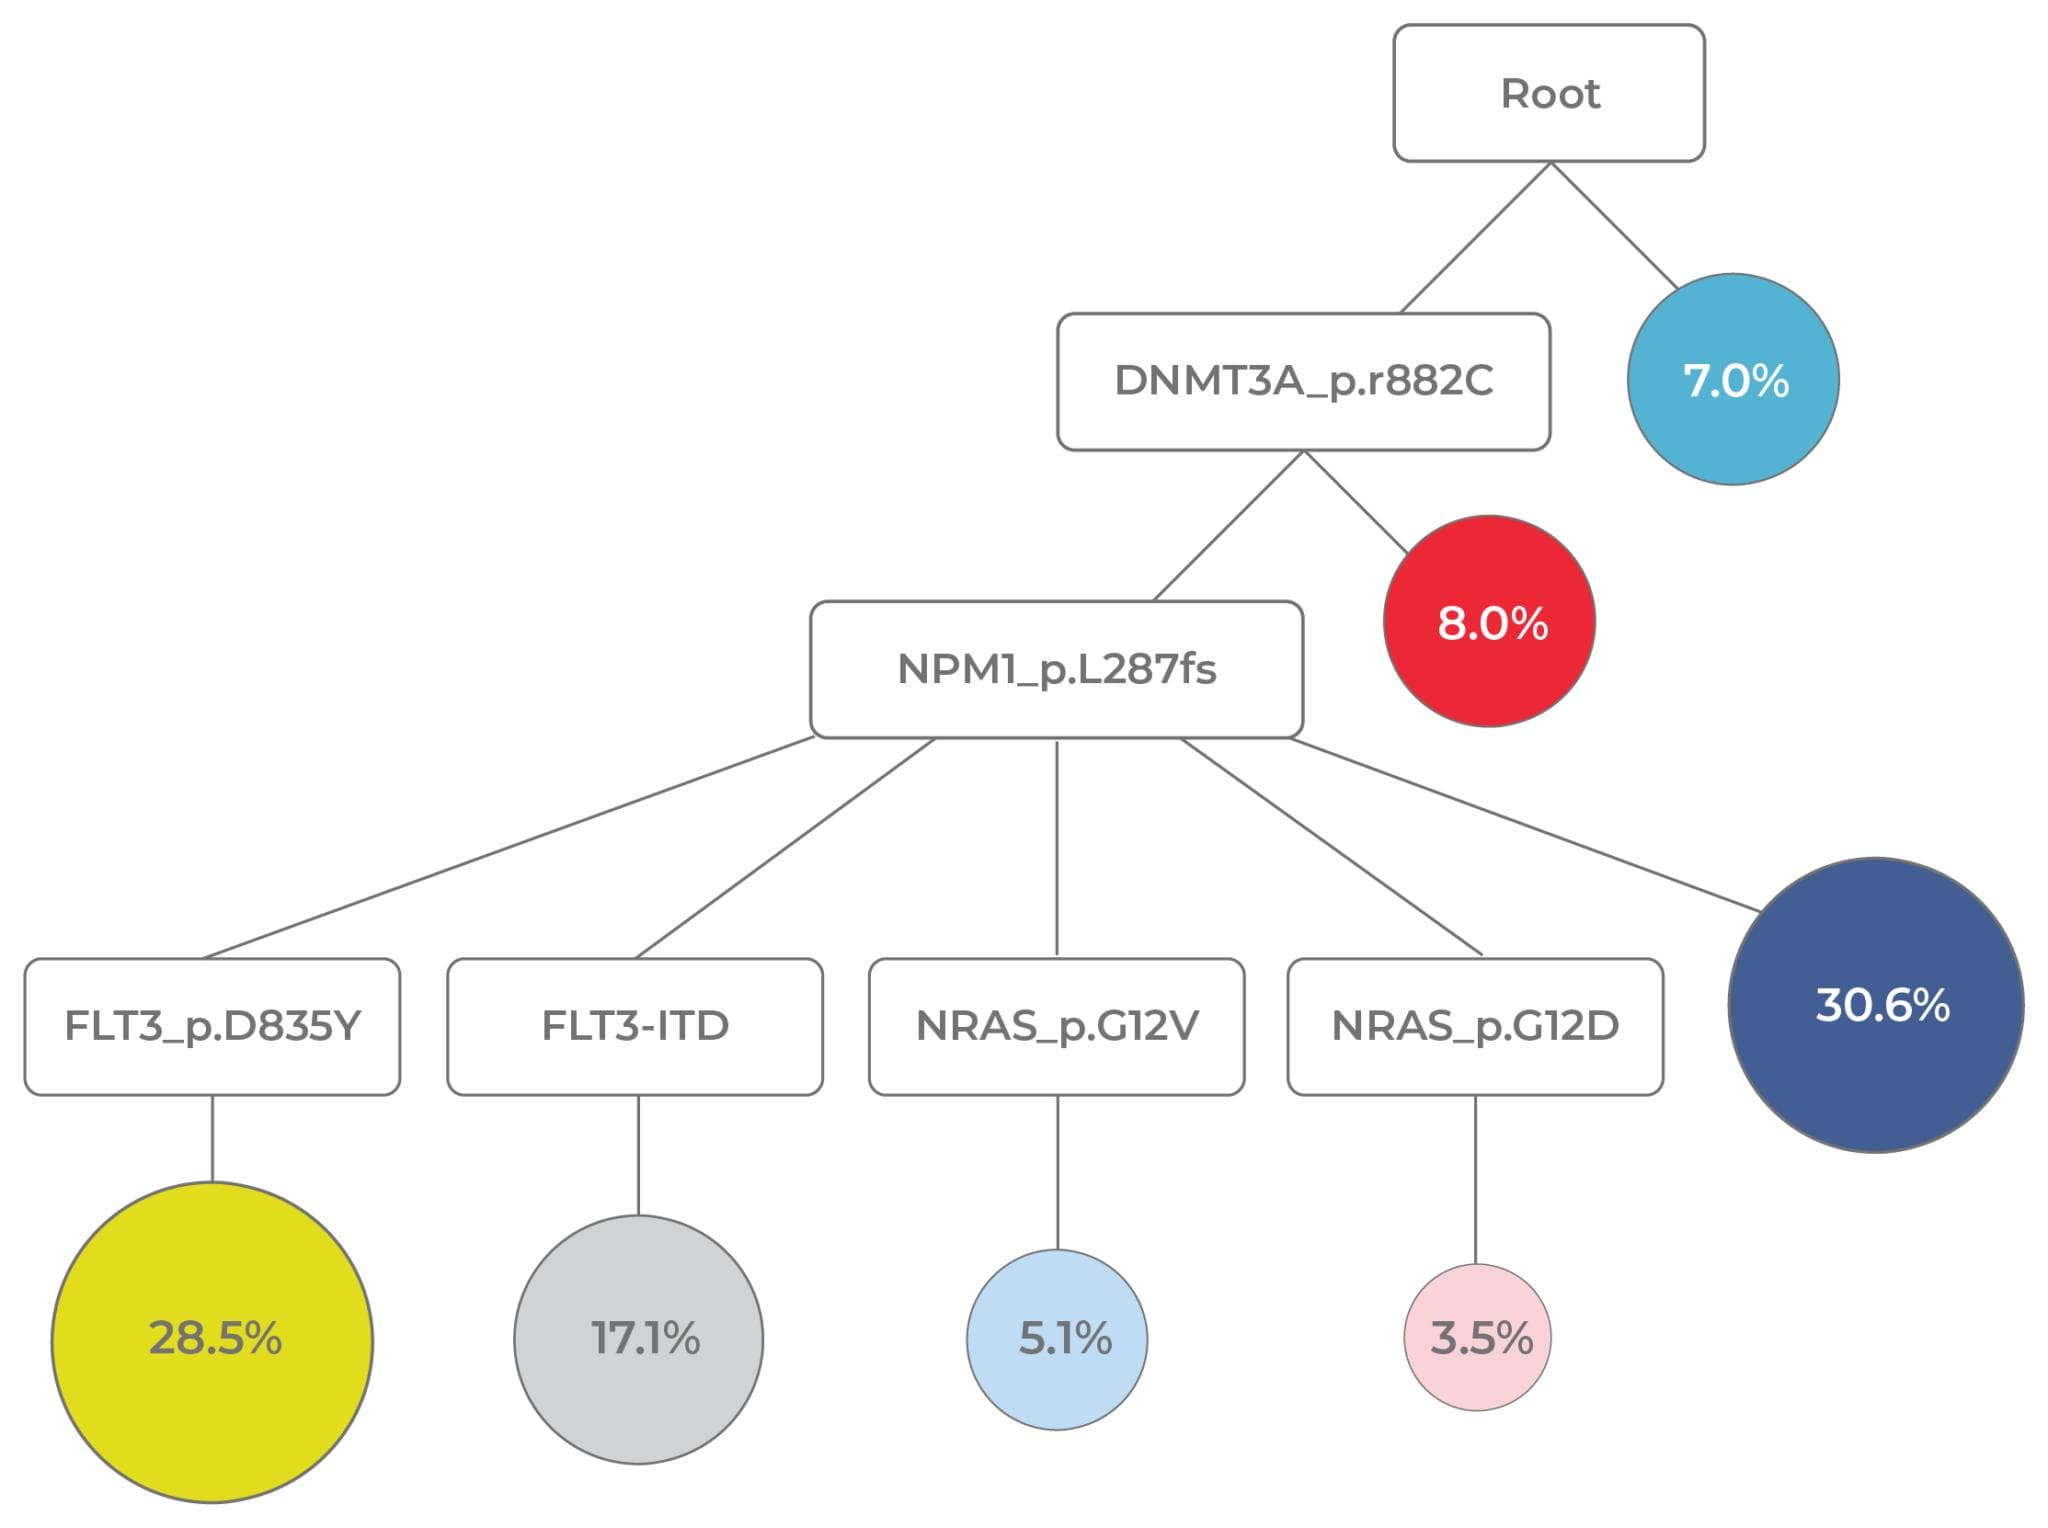
One growing single-cell sequencing application is the reconstruction of tumor evolutionary histories. Because single-cell analysis assigns mutations to different clones, phylogenetic trees can be reconstructed based on patterns of co-mutation.
Reassembling clonal histories not only reveals the overall pattern of evolution (linear vs. branched) but also enables researchers to understand other important aspects of disease progression. For instance, disease-initiating mutations, as well as patterns of mutual exclusivity and co-occurrence, are identified. Assessing cooperative mutations that give cells a fitness advantage is particularly illuminating. For instance, in the AML phylogeny depicted in Figure 11, the co-mutations, DNMT3A and NPM1, enabled a clone (dark blue circle) to expand and compose about 30% of the tumor.
Phylogenetic studies that leverage single-cell analysis are contributing valuable insights into cancer. For instance, Miles et al. (2020) revealed the chronological order of mutational acquisition as well as cooperative mutations that drove clonal expansion in AML. This study also found that evolutionary patterns differed across stages of disease progression.5 In another AML study, Morita et al. (2020) discovered linear and branched patterns of evolution, with some subclones independently acquiring mutations in the same genes (convergent evolution). Proteogenomic profiling in both of these studies enabled the simultaneous characterization of mutational profile and cell type/state in an evolutionary context.4
These studies are shedding new light on the behavior of cancer. Not only do these endeavors contribute foundational knowledge to malignant transformation, but there is mounting evidence they have prognostic value. For instance, higher intratumoral heterogeneity is associated with the development of drug resistance and poorer prognosis in AML.9,10 In the heme field alone a number of indications are actively being investigated, including CH, AML, MPN, MDS, multiple myeloma, CLL, and ALL.4,5, 11-13 As tumors continue to be profiled across patients, general patterns of evolution will likely become apparent.
Therapeutic Resistance
Of the many single-cell sequencing applications in oncology, the use of single-cell data to identify mechanisms of therapeutic resistance holds a lot of promise in personalized medicine. Although anti-cancer therapies often succeed in bringing patients into complete remission (CR), tumors often relapse at a later time point. The failure to eliminate cancer entirely is often due to the heterogeneity and dynamism of the disease.
Tumor cells can evade treatment through primary resistance, in which pre-existing mutations offer protective properties. Alternatively, secondary resistance may emerge through mutations acquired during the course of treatment. Because most tumor cells succumb to therapy, cells that survive have little competition for resources. Even small initial quantities of resistant cells can rapidly expand and drive relapse. The ability for tumors to adapt in this fashion lies at the root of therapeutic failure.
Though cancer’s uncanny ability to evade treatments remains a significant challenge, understanding this process may enable us to beat cancer at its own game. Single-cell DNA sequencing offers considerable value over traditional bulk analysis. Because bulk is unable to unambiguously delineate mutational co-occurrence across different clones, it is not possible to determine whether all clones will be targeted by a given therapy. Single-cell DNA sequencing can detect high-risk clones early on so that treatment plans can be adjusted to reduce the likelihood of relapse.
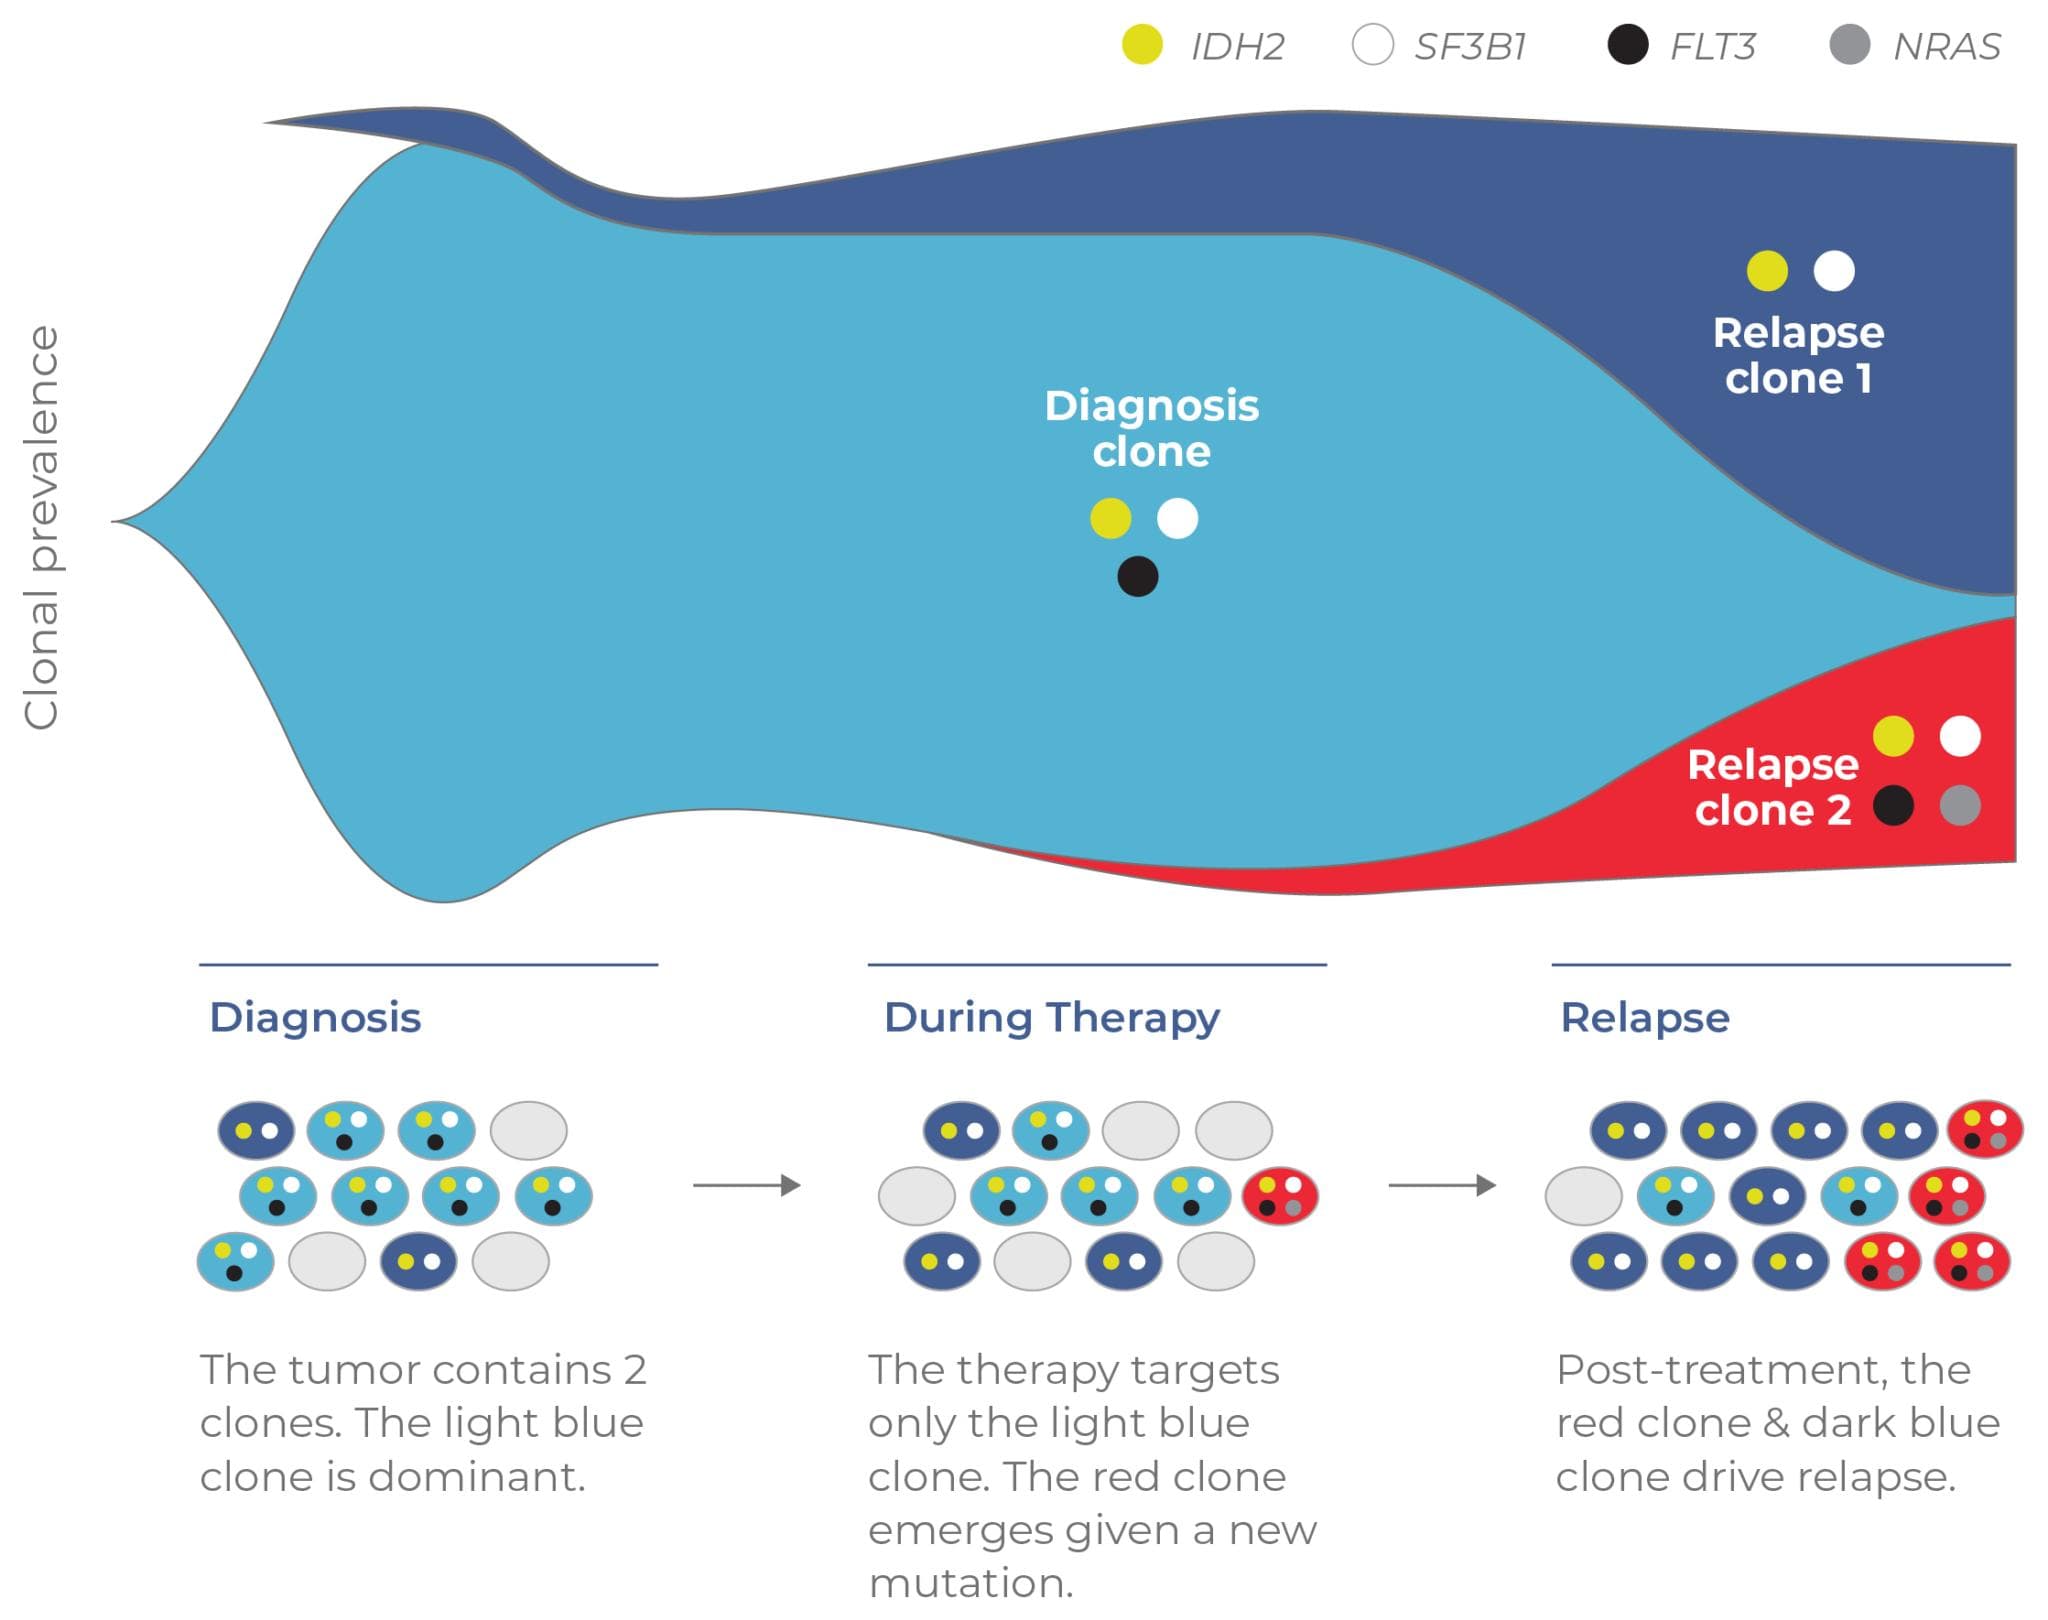
To illustrate the value of single-cell analysis, consider the example of a longitudinal study of a relapsed AML patient who received the targeted FLT3 inhibitor therapy, gilteritinib (Fig 12). At the time the patient was treated, peripheral blood was tested at three timepoints (diagnosis, during therapy, and at relapse) using bulk NGS. Because bulk analysis cannot resolve clonal structure, there was no way to determine the clones present at each time point. When the blood samples were analyzed with single-cell DNA sequencing in a retrospective study, the tumor architecture was revealed.
This lack of clonal resolution in the initial study meant that clones that led to relapse were missed. For instance, at the diagnosis timepoint, the light blue clone was effectively targeted by gilteritinib while the dark blue clone was not (due to lacking the FLT3 target). This latter clone expanded post-therapy and contributed to relapse. Similarly, a novel clone (red) that emerged during treatment had acquired resistance to gilteritinib via an NRAS mutation. This clone was too rare to be detected by bulk NGS during treatment (comprising only 0.1% of the tumor). Hence, it was free to expand unabated and contributed to relapse.
Using single-cell data to inform personalized treatment strategies holds promise for reducing rates of relapse. By resolving the clonal structure of a tumor prior to treatment, combinational therapies can be developed to ensure all clones are targeted. Surveillance during treatment can also ensure that any new therapy-resistant clones are identified. An increasing number of studies are using single-cell DNA sequencing to uncover mechanisms of resistance in clinical trials, further underscoring the potential of this technology in a therapeutic setting.4,5,8,14
Minimal Residual Disease (MRD)
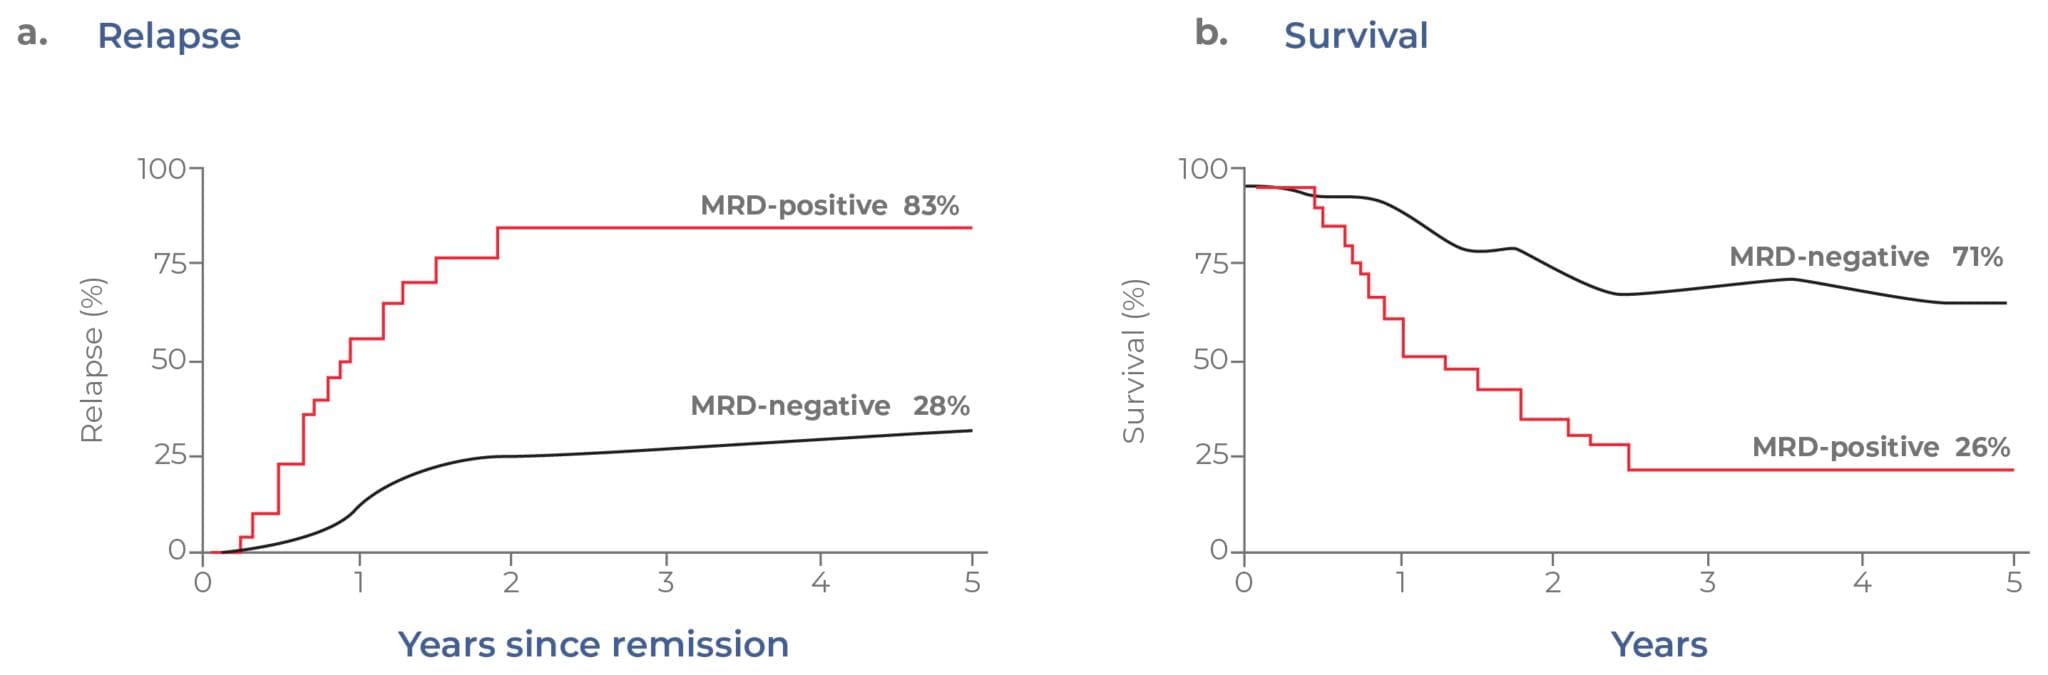
Another impactful single-cell sequencing application is the detection of small numbers of malignant cells — called minimal residual disease (MRD) — present in the body. Despite advances in anti-cancer therapeutics, it is not uncommon for resistant cells to escape therapy and drive relapse. Even for patients that have achieved complete remission, small quantities of remaining pathogenic cells often remain. For myeloid malignancies, MRD is a powerful predictor of treatment outcomes. Data from clinical trials have revealed that the presence of MRD is indicative of both faster relapse and lower overall survival (Fig 13).15 MRD is becoming established as a surrogate marker for relapse-free survival and could one day be used as a regulatory endpoint for drug approval.16
Given its clinical implications, MRD detection assays are commonly performed following induction chemotherapy. If malignant clones are detected and characterized, early action can be taken to intervene. Conventionally, MRD is identified by either genotype or immunophenotype. Traditional genotypic methods like PCR, qPCR, or bulk NGS detect mutation frequencies but do not assign aberrations to distinct clones. Without this clonal structure, the identification of malignant cells is limited.
MRD may also be detected through immunophenotyping (typically through multi-parameter flow cytometry). In AML, for instance, MRD is identified by flow-sorting cells based on the abnormal pattern of markers expressed by blast cells. However, the sensitivity of this assay is limited, as common markers are expressed by both healthy and leukemic cells.
Single-cell multi-omics (DNA + protein) analysis combines the strengths of both assays into a single workflow. The use of multiple analytes to detect aberrant cells enhances the detection of residual disease.17,18 For example, Dillon et al. (2020) reported an AML case in which leukemic cell-surface markers were present on only half of cells with malignant genotypes.18 Here the use of DNA + protein multi-omics enabled MRD to be characterized to a fuller extent than either analyte could have alone. In the clinic, this highly-specific information can be used to guide personalized treatment regimens.
Clonal Hematopoiesis of Indeterminate Potential (CHIP)
Single-cell analysis can aid in the identification of MRD, but distinguishing diseased cells from benign ones is not always clear-cut. For blood cancers, a relatively recent single-cell sequencing application is the ability to distinguish malignant cells from non-malignant ones that share some of the same mutations.
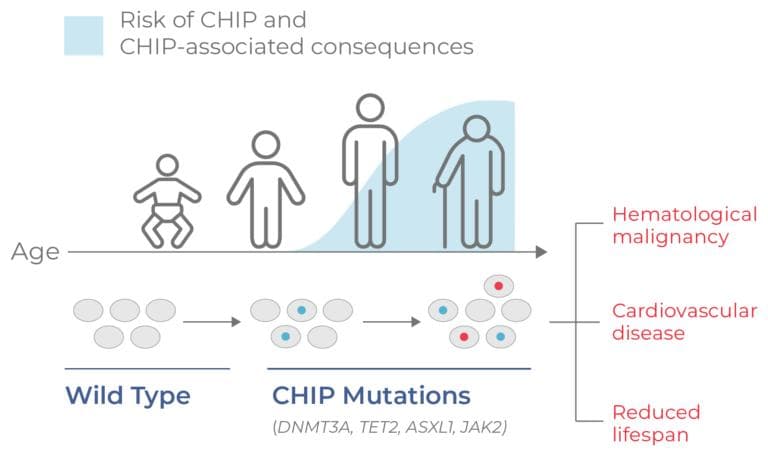
Blood cancers like AML begin with hematopoietic stem cells (HSCs) — cells that reside in the bone marrow and give rise to all descendant blood cells. These cells rarely divide and thus have relatively stable genomes. However, as humans age they gradually acquire somatic mutations. Mutations in a particular set of epigenetic regulators (commonly DNMT3A, TET2, and ASXL1) give HSCs a competitive edge, enabling them to clonally expand in a process called clonal hematopoiesis of indeterminate potential (CHIP). Although these mutations lead to clonal subpopulations, the cells are not yet malignant and do not cause symptoms of disease. However, they are predisposed to acquiring additional mutations that lead to full leukemic transformation. Thus, people with CHIP mutations are considered to have the potential to develop hematologic malignancies like myelodysplastic syndromes (MDS) and acute myeloid leukemia (AML).
CHIP is an age-driven process, occurring in about ~ 20% of the US population. Somatic mutations in epigenetic genes (occurring at ≥ 0.02 VAF) appear in middle age and increase over time (Fig 14).19 In addition to a higher risk of developing a hematologic malignancy, the presence of CHIP has also been correlated with a higher risk of developing cardiovascular disease and reduced lifespan.
The etiology of CHIP is not well understood. For clinicians, one area of particular interest is the ability to differentiate CHIP (premalignant) and oncogenic clones. Because CHIP cells have mutations that are also found in leukemic cells, it is often difficult to distinguish the two. However, the clonal structure of these mutations can be used to verify whether cells are pathogenic or not.
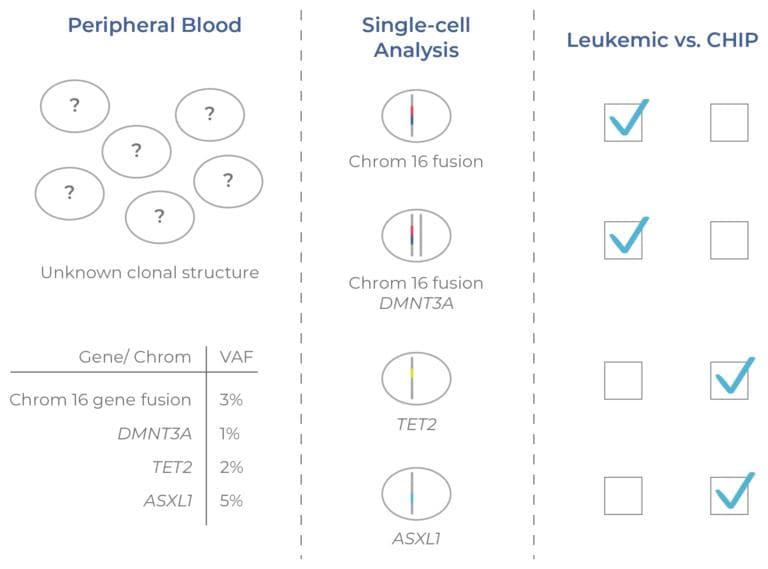
The clonal structure of residual disease can be evaluated using single-cell DNA sequencing.17 As an illustrative example, Figure 15 shows a cell population with several genetic aberrations at low frequencies. While the substructure of the tumor cannot be determined from the VAFs alone (an output of bulk NGS), it can be resolved with single-cell DNA sequencing. Here, the two leukemic clones have a gene fusion in chromosome 16 (a defining feature of AML). The CHIP clones have single mutations in either TET2 or ASXL1 that do not co-occur with the chromosome 16 fusion (indicating they are not leukemic).
Single cell DNA+ protein multi-omics can also be leveraged to distinguish MRD from CHIP clones. By layering genotypic and immunophenotypic information, malignant and non-malignant clones can be identified with greater confidence. Indeed, Dillon et al. (2020) used single-cell proteogenomic profiling to assess residual disease in relapsed AML patients.
Whereas traditional methods of MRD identification — genetic sequencing and flow cytometry — are often discordant, this study was able to overcome this limitation by combining genotypic and immunophenotypic profiling. Using single-cell multi-omics, the authors were able to confidently resolve the clonal architecture of three patients and distinguish CHIP and AML clones.18

Interested in Single Cell for Pharma Applications?
Leverage single-cell technology to identify mechanisms of resistance and accelerate your drug development pipelines.
Vocabulary
Complete remission (CR): no cancer is detected by standard lab tests and imaging.
Primary resistance: pre-existing mutations confer resistance to a therapeutic.
Secondary resistance: mutations that emerge during treatment confer resistance to a therapeutic.
Minimal residual disease (MRD): small quantities of cancer cells that remain in the body following cancer treatment. Also called: measurable residual disease.
Clonal hematopoiesis of indeterminate potential (CHIP): the process of mutational acquisition and subsequent clonal expansion of hematopoietic stem cells (HSCs), resulting in non-malignant clones. Also called: age-related clonal hematopoiesis